
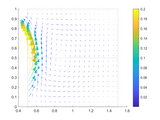
Quiver Color and Length management
Functions to change aspects of Quiver plots in Matlab. Color, length of vector, length of head and angle of the head can easily be changed.
I provide two functions.SetQuiverColor and SetQuiverLength.The function SetQuiverColor is heavily based on the answer by Suever found on Stackoverflow forum
- 323 (All time)
- 2 (Last 30 days)
- 5.0 / 5
- Community
-
16 Jul 2019

Quiver - magnitude-dependent color in 2D and 3D
Implements the MATLAB given quiver/quiver3 function adding a color coding depending on magnitude
%quiverC3D creates a 3D quiver plot and adds a color coding. The color coding is%given by the magnitudes of the component vectors. Large values result in colors %from the upper end of the used
- 3.8K (All time)
- 8 (Last 30 days)
- 4.6 / 5
- Community
-
2 Nov 2021

Quiver (vector) with a reference vector or color code on a map or Cartesian axes.
This function is a substitute for the standard versions of quiver and quiverm available using a vanilla release of matlab. This version assumes a 2D vector field is being plotted using a gridded flow
- 8.7K (All time)
- 7 (Last 30 days)
- 4.9 / 5
- Community
-
23 Feb 2015

Creates a color quiver plot with arrows colors according to the magnitude of the vector.
This is a modified version of the function quiver [from C.M. Thompson] to plot velocity vectors as arrows with components (u,v) at the points (x,y) with the color corresponding to the magnitude of
- 14.2K (All time)
- 4 (Last 30 days)
- 4.5 / 5
- Community
-
26 Nov 2008

3D Quiver with volumized arrows
Produce a 3D quiver of arrows with many visualization options
This quiver3D differs from the basic quiver3 in that it allows far more options for visualization. Based on the 'surf' command, you can produce color-based visuals of your data via the multiple
- 4K (All time)
- 3 (Last 30 days)
- 5.0 / 5
- Community
-
18 Sep 2006
Color quiver based on magnitude or angle. Also, support uniform sampling by averaging or taking the fastest velocity within each grid cell.
patches which are used for drawing heads and tails.quiv = cquiver(x, y, u, v, 'cdata', 'angle') set color based on angle.quiv = cquiver(x, y, u, v, 'sampling', h) plots quiver plotat uniform grid where grid
- 583 (All time)
- 2 (Last 30 days)
- 5.0 / 5
- Community
-
21 Jun 2019

This function provides an improvement over the QUIVER3 technique for visualizing 3D vector fields.
and contain the corresponding position and velocity% components. QUIVER3D automatically scales the arrows to fit.% % QUIVER3D(X,Y,Z,U,V,W,COLOR) provides an input argument for coloring
- 5.3K (All time)
- 3 (Last 30 days)
- 4.3 / 5
- Community
-
21 Oct 2004

quiver with color w/r to mag with colormap an NaN support.
Draws a quiver plot with arrows whose colors are w/r to the default color map and the magnitude of the data. It displays a colormap whose limits accurately reflect the data. Works with NaNs
- 3.6K (All time)
- 2 (Last 30 days)
- 4.0 / 5
- Community
-
28 Mar 2005

Plotting of colored 3D arrows based on patch command
This function allows plotting of colored 3D arrows by generating patchdata (faces “F”, vertices “V” and color data “C”). The patch data whichallows plotting of 3D quiver arrows with specified (e.g
- 1.6K (All time)
- 2 (Last 30 days)
- 5.0 / 5
- Community
-
28 Apr 2015

Quiver vector plot with reference vector showing scale
Quiver vector plot function with reference vector showing the scale of the vector magnitude. Scale location adjustable as well as units. Best used foe publication or technical papers when color is an
- 3.5K (All time)
- 2 (Last 30 days)
- 5.0 / 5
- Community
-
19 Jun 2009

Color segmentation by Delta E color difference
User draws region and this finds pixels in the image with a similar color, using Delta E.
Demo to perform very, very simple color detection in LAB color space. The RGB image is converted to LAB color space and then the user draws some freehand-drawn irregularly shaped region to identify a
- 13.4K (All time)
- 3 (Last 30 days)
- 4.6 / 5
- Community
-
19 Apr 2011

This is a modified version of the function quiver3 with color plot.
This is a modified version of the function quiver3 to plot velocity vectors as arrows with components (U,V,W) at the points (X,Y,Z) with the color corresponding to C data. From the idea of Suever
- 94 (All time)
- 1 (Last 30 days)
- -- / 5
- Community
-
6 May 2018

Convert between RGB and Color Names
RGB to color name. Color name to RGB. Supports many palettes: CSS, dvips, HTML, MATLAB, RAL, SVG, X11, xcolor, xkcd,...
One function converts between RGB and color names, in both directions.The function COLORNAMES accepts either RGB values or color names as its inputs, and returns the color names and RGB values from
- 3.3K (All time)
- 16 (Last 30 days)
- 5.0 / 5
- Community
-
31 Mar 2026

Intuitive RGB color values from XKCD
RGB triplets for 949 colors, by how they're perceived on a computer monitor and their common names.
This function returns the RGB triplet for almost any color. And unlike the way colors are somewhat officially defined (http://en.wikipedia.org/wiki/Web_colors), this data set describes returns
- 4.9K (All time)
- 9 (Last 30 days)
- 4.9 / 5
- Community
-
12 Jun 2017

The frequency image is where the pixel intensity represents the frequency of the same color pixels.
This is a MATLAB implementation of the Color Frequency concept introduced by T. Kashiwagi & S. Oe.With this script, you pick a color image and then it computes the color frequency image. The
- 1.9K (All time)
- 2 (Last 30 days)
- 4.3 / 5
- Community
-
9 Jul 2010

Detect colored regions in an image via thresholding in HSV color space.
This script is a demo that shows you how to find objects of a certain color in an image. For this example I'm using the standard onion, peppers, or kids image that ships with the Image Processing
- 22.7K (All time)
- 7 (Last 30 days)
- 4.4 / 5
- Community
-
19 Dec 2015

cprintf - display formatted colored text in Command Window
Displays sprintf-formatted strings in the Command Window using the specified color/underline/bold style
RGB color format (range: 0.0-1.0) [26, 178, 76] - numeric RGB values (range: 0-255) '#1ab34d' - Hexadecimal format (range: '00'-'FF', case insensitive). 3-digit HTML format also
- 29.6K (All time)
- 120 (Last 30 days)
- 4.9 / 5
- Community
-
22 Apr 2026

Quiver plot with filled triangles head
% setting of the quiver body width%% QUIVER_TRI(x,y,u,v,headsize,headangle,width,col) same as before, plus% setting of the color%% See also QUIVER.
- 652 (All time)
- 4 (Last 30 days)
- 5.0 / 5
- Community
-
25 Apr 2016
Plots matlab quiver with log scaling while maintaining proper arrows directions.
Normally when using quiver, the arrows' size change linearly with the data. However, sometimes the data will appear more naturally in a logarithmic scale, and plotting this is not possible using
- 326 (All time)
- 3 (Last 30 days)
- 5.0 / 5
- Community
-
15 Oct 2018

Fast edges of a color image (actual color, not converting to grayscale)
Edges of a color image by the max gradient method.
Extracts the edges of a color image without converting it to grayscale.Changes in color are detected even when the grayscale color of two pixels are the same. The edge strength is typically greater
- 6K (All time)
- 3 (Last 30 days)
- 4.7 / 5
- Community
-
7 Jul 2010

Rotates the direction of quiver arrows produced by quiver().
Rotate the quiver arrows produced by quiver() about their (x,y) base by any specified angle in degrees or radians. h = quiver(X, Y, U, V); quiverRotate(h) Rotate existing arrows by
- 305 (All time)
- 4 (Last 30 days)
- -- / 5
- Community
-
17 Apr 2020

Same as QUIVER, QUIVER3 or FEATHER but with colored, normalized, widened and ARROW's!
This program use QUIVER/QUIVER2 to generate a vector field specialized plot and then customizes the arrows according to its length.Just type>> quiver2(U,V)and that's it. You get - customized
- 4K (All time)
- 1 (Last 30 days)
- 4.8 / 5
- Community
-
12 Nov 2009

Drawing Color Histograms and Color Clouds
Matlab code to plot color histograms and color clouds
Usage: createColorHistograms(im_str)im_str can be an image file location or a three-dimensional arrayThere seem to be two confounds in plotting color histograms. One is the obvious one of showing a
- 12K (All time)
- 4 (Last 30 days)
- 5.0 / 5
- Community
-
1 Aug 2010

RGB triple of color name, version 2
Returns a Matlab RGB color specifier corresponding to a given color name (139 colors supported).
RGB = RGB('COLORNAME') returns the red-green-blue triple corresponding to the color named COLORNAME by the CSS3 proposed standard [1], which contains 139 different colors (an rgb triple is a 1x3
- 22.3K (All time)
- 22 (Last 30 days)
- 5.0 / 5
- Community
-
5 Jul 2009

Create tints of colors and colormaps
Create specified tints of colors and colormaps or show examples of tints.To create shades, see http://www.mathworks.com/matlabcentral/fileexchange/47245-color-shades
- 465 (All time)
- 1 (Last 30 days)
- 5.0 / 5
- Community
-
16 Jul 2014

Scales multiple quiver plots to use the same length scale.
SCALE_QUIVERS(QH, SCALE) scales multiple quiver plots to use the same length scale (by default, the longest vector)QH is a vector of handles to the quiver plots. Note that a handle of a quiver plot
- 135 (All time)
- 1 (Last 30 days)
- 5.0 / 5
- Community
-
8 Nov 2018

Create color maps from actual names that people use for colors.
viewers more than 900 of the most commonly-used colors on the internet, and getting users to use their own words to describe that color. The result is a database of the most commonly-used names for colors
- 1.9K (All time)
- 5 (Last 30 days)
- 5.0 / 5
- Community
-
20 Jun 2014

Script to do simple color detection in RGB color space. Finds red objects in the image.
This script is a demo that shows you how to find objects of a certain color in an image. For this example I'm using the standard onion, peppers, or canoe image that ships with the Image Processing
- 21.4K (All time)
- 4 (Last 30 days)
- 4.8 / 5
- Community
-
17 Feb 2018

Tracking red color objects using matlab
This program just tracks all red color objects and draws a bounding box around them.
This program just tracks all red color objects and draws a bounding box around them. This works on the difference between frames concept. Every frame in the video is returned as an rgb image on which
- 33.1K (All time)
- 1 (Last 30 days)
- 4.7 / 5
- Community
-
17 Nov 2010

Maximally Distinct Color Generator
Generate maximally-distinct colors in an RGB colormap.
: https://en.wikipedia.org/wiki/Oklab_color_spaceOptional input arguments allow the user to:Limit the lightness range.Limit the chroma range.Provide a colormap of colors to be excluded (e.g. background colors, existing plot colors).Provide a colormap of
- 2.3K (All time)
- 15 (Last 30 days)
- 5.0 / 5
- Community
-
1 Apr 2026
Color Tools for MATLAB is an experimental collection of MATLAB functions related to color science computation and visualization.
Color Tools for MATLAB is an experimental collection of MATLAB functions related to color science computation, color scales, visualization, and ICC color profiles. It is meant to supplement the
- 1.1K (All time)
- 4 (Last 30 days)
- 5.0 / 5
- Community
-
27 Jan 2023

Color Palette Tables (.cpt) for Matlab
Create and apply GMT-style colormaps in Matlab
## cptcmap.m DocumentationAuthor: Kelly Kearney[
Gray image to Color image conversion
Converts a gray image to color image
This program converts a gray image to color image. The conversion is based on color image submitted along with the input gray image. Actualy it transfers color to a grayscale image. The
- 20.8K (All time)
- 3 (Last 30 days)
- 4.2 / 5
- Community
-
22 Apr 2016

error plot for lab color coordinates
This function can be used to create various plots of errors related to Lab color coordinates.
This function can be used to illustrate error values related to datapoints of CIE-L*a*b* color coordinates. A larger error is plotted by a larger marker, or in quiver plots by longer vectors.This is
- 592 (All time)
- 1 (Last 30 days)
- 5.0 / 5
- Community
-
7 Jan 2014

Computational Colour Science using MATLAB 2e
Colour toolbox that accompanies the second edition of Computational Colour Science using MATLAB
Colour toolbox that accompanies the second edition of Computational Colour Science using MATLAB (Westland, Ripamonti and Cheung, 2012).Toolbox allows spectral interpolation, calculation of colour
- 9.1K (All time)
- 6 (Last 30 days)
- 4.8 / 5
- Community
-
5 Mar 2013

MATLAB Image Manipulation Toolbox
functionality.Let me know if you find bugs. Highlights:GUI extensions of several core functionsPassthrough/fallback replacements for several IPT toolsMulti-model color picker GUIGUI for parametric color-based mask
- 9.4K (All time)
- 91 (Last 30 days)
- 5.0 / 5
- Community
-
4 Jul 2024
Color name identification: fuzzycolor
Efficient identification of color names for any RGB
Yes, its easy to identify [1, 0, 0] as a red color. But sometimes we want to find ALL colors in an image that we would identify as red. Thus, [1, 0.1, 0.1] is also easily seen as red by the eye. Its
- 5.6K (All time)
- 1 (Last 30 days)
- 4.0 / 5
- Community
-
20 Sep 2006

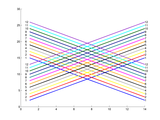
Generate maximally perceptually-distinct colors
Choose a set of n colors that can be readily distinguished from each other
When plotting a set of lines, you may want to distinguish them by color. By default, Matlab chooses a small set of colors and cycles among them, and so if you have more than a few lines there will be
- 36.7K (All time)
- 49 (Last 30 days)
- 4.9 / 5
- Community
-
7 Feb 2011

- 25.2K (All time)
- 16 (Last 30 days)
- 3.5 / 5
- Community
-
3 Jul 2011

Plot georeferenced vector fields with color options.
a way that their zonal components shrink to zero at the poles.In addition to fixing the problems described above, quivermc also allows a few extra options including color settings, arrow density, and
- 4.1K (All time)
- 5 (Last 30 days)
- 4.4 / 5
- Community
-
22 Aug 2014

This function can be used to create various plots of Lab color coordinates.
The plot_Lab function is a simple tool to create nice-looking Matlab figures of CIE-L*a*b* color coordinates of a set of data samples.Features:-> plots can be created in true-color (each datapoint
- 3K (All time)
- 1 (Last 30 days)
- 5.0 / 5
- Community
-
7 Jan 2014

Spectral and XYZ Color Functions
Label plots with spectra. Convert wavelengths to RGB. Functions for color matching and illuminants.
This is the beginning of a set of functions for working with color as wavelengths (spectral color) and in the xyY and XYZ color spaces.Current functionality includes:spectrumLabel - Add a color bar
- 19.1K (All time)
- 14 (Last 30 days)
- 4.1 / 5
- Community
-
8 Nov 2010

ColorBrewer: Attractive and Distinctive Colormaps
The complete palette of ColorBrewer colormaps. Simple selection by scheme name and map length.
BREWERMAP Function==================[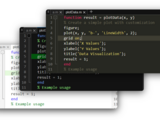
Easily customize MATLAB’s color settings by selecting and applying color schemes from MATLAB Color Theme Extensions.
# MATLAB Color Theme Extensions[
- 6.9K (All time)
- 3 (Last 30 days)
- 4.8 / 5
- Community
-
2 Feb 2009

Synthesize a perfect version of the X-Rite Color Checker chart.
The X-Rite Color Checker Chart is a very common standard used for standardizing different images and imaging systems. (This chart has been known in the past as the Gretag Macbeth Color
- 4.7K (All time)
- 2 (Last 30 days)
- 4.5 / 5
- Community
-
19 Sep 2012

Several color conversion and graphic tools to play around with
Several color conversion and graphic tools to play around with There are mainly three functionalities1) conversion between color spaces (RGB, HSV, HSL, XYZ, xyY, Lab), here nothing new2) Constructing
- 706 (All time)
- 2 (Last 30 days)
- 5.0 / 5
- Community
-
30 Dec 2016

Generate vertices, faces and color for u3d format
Generate vertices, faces and color for u3d format and display it in pdf or doc, xls and ppt
- 2.7K (All time)
- 4 (Last 30 days)
- 5.0 / 5
- Community
-
14 Apr 2010

A constant-lightness cyclic colormap for phase.
lightness is good for displaying phase because it does not put strong emphasis on any part of the color map. A well-written and aesthetically-pleasing overview of Kristen's cmocean colormaps can be found
- 2.2K (All time)
- 12 (Last 30 days)
- 4.9 / 5
- Community
-
20 May 2019
A colormap that attempts to be color blind friendly
This is a .mat file that contains 12 colors specified by Matlab color triplets. The file contains a matrix of colors(each row is 1 color) as well as a matrix of the names for each color. The names
- 2.5K (All time)
- 8 (Last 30 days)
- 5.0 / 5
- Community
-
30 May 2014

Color Marker based Object Tracking
Color marker based object tracking for video analysis using Kalman filter
This demo shows a color marker based object tracking for video analysis. You can use a custom color mask function created by using colorThreshoulder app.The tracking performs robustly because missing
- 482 (All time)
- 2 (Last 30 days)
- 5.0 / 5
- Community
-
25 Jan 2018

Plots a 3D line with color encoding along the length using the patch function.
This function plots a 3D line (x,y,z) encoded with scalar color data (c). This function is an improvement over the CLINE function previously made available on TMW File Exchange. Rather than using
- 6.9K (All time)
- 3 (Last 30 days)
- 3.9 / 5
- Community
-
31 Mar 2016

Superpixel-based Fast FCM for Color Image Segmentation
Color image segmentation
We propose a superpixel-based fast FCM (SFFCM) for color image segmentation. The proposed algorithm is able to achieve color image segmentation with a very low computational cost, yet achieve a high
- 1.9K (All time)
- 5 (Last 30 days)
- 5.0 / 5
- Community
-
27 Apr 2020

- 1.3K (All time)
- 2 (Last 30 days)
- 4.0 / 5
- Community
-
15 Apr 2005

Color Detection Using HSV Color Space (Training and Testing)
The provided Matlab functions demonstrate a simple method for training and testing a color detection
The provided Matlab functions demonstrate a simple method for training and testing a color detection system. In general, a color detection algorithm searches an image for pixels that have a specific
- 14.7K (All time)
- 2 (Last 30 days)
- 4.6 / 5
- Community
-
24 Jan 2008

Create KML/KMZ files and view them in Google Earth. Supports 3D models, contours, overlays, and more
- 16.9K (All time)
- 12 (Last 30 days)
- 4.6 / 5
- Community
-
3 Mar 2016

RGB Color Detection in Images Real Time Video
RGB color detection in images and Real time video is presented in this project.# Color Detection in Image 1. Click on Use Image 2. Select image source *Demo Image (Already in files) *Browse
- 5.5K (All time)
- 1 (Last 30 days)
- 5.0 / 5
- Community
-
24 Jul 2012

Yet Another Color Gamut Visualizer
This tool helps to visualizes color volume by constructing a 3D gamut(s) given point cloud of color values.
This tool helps to visualizes color volume by constructing a 3D gamut(s) given point cloud of color values.Please visit GitHub page (https://github.com/QiuJueqin/Yet-Another-Color
- 154 (All time)
- 2 (Last 30 days)
- 5.0 / 5
- Community
-
31 May 2019

colormapline - color-changing 2D or 3D line
Plot a 2D or 3D line using a specified colormap.
color% does NOT depend on any coordinate.% Technically, length(colormap) lines are plotted, each with a different% color from the colormap in ascending order.% H is a handle to the complete
- 1.9K (All time)
- 1 (Last 30 days)
- 5.0 / 5
- Community
-
14 Dec 2016

Apply and save color schemes in MATLAB with ease.
MATLAB Schemer makes it easy to change the color scheme (a.k.a. theme) of the MATLAB display and GUI.You can use Schemer to import a predefined color scheme, transfer your color settings between
- 134.8K (All time)
- 155 (Last 30 days)
- 5.0 / 5
- Community
-
9 Jun 2023