39 results

enhanced zooming, ticks, and interactive exploration of yyaxis charts
Pan and zoom with simple keystrokes.
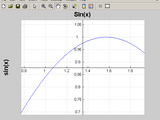
Puts axes in the center of a plot. Zooming, panning and some command line manipulations allowed.

zoom / pan / rotate / datacursor hotkeys for a figure

Label axis with date ticks that automatically update when zooming or panning
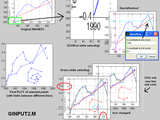
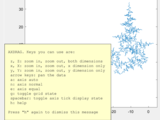
Same as GINPUT but with ZOOM, PAN and (optionally) PLOT and image SCALE/GEOREFERENCE!
Easily zoom, pan, rotate the camera in a Matlab axis with left/center/right mouse button
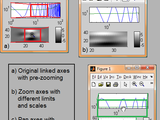
Links the ZOOM and PAN regions of different axes.

DRAGZOOM allows you to handy interactively manage the axes in figure.
Same as DATETICK but with ZOOM, PAN, LINKAXES and more!

Quickly zoom & scroll through your signal. Apply digital filter and adapt it on the fly, via GUI

Allows horizontal and vertical panning via pushbuttons.
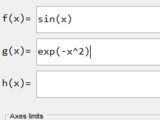
MATLAB app that makes plotting functions easy and fun

datefig: figure handle class with automatically readjusting date ticks
Version 1.1.0.0
Mark MikofskiHandle class object that automatically resets date ticks after resize, zoom or pan.

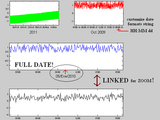
Adds a new linked axis related by ANY monotonic function. Includes ZOOM/PAN and DATETICK utility!
Link the axes of different figures for zoom and pan
ginput function with online zoom and pan capability.

Interactively pan, zoom, center view a plot using the mouse
Same as FIGURE, but zooming/panning is done more conveniently with scroll wheel/clicks.

Scroll through and zoom in/out of plot with arrow keys.

Computes coherent and spontaneous Rayleigh-Brillouin spectra using s6 (Tenti) or s7 (Pan) models

Zooming and panning with the mouse in 2D plots. Supports plotyy, loglog, subplot, etc.

Add multiple X or Y axes to plots, rescale data, use any function, add data tips, zoom, flexible.

Date formatted tick labels, automatically updated when zoomed or panned.

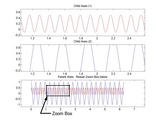
Creates a plot with an overview axes in the figure.

Interactive exploration of a 3D plot: rotate, zoom, pan, put data tip.
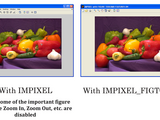
IMPIXEL_FIGTOOLS Pixel color values with figure tools on.

Scroll and zoom in/out of axes using arrows keys. Display part of total data currently in view.

Multiple data sets are managed and compared with the mouse, by shifting objects and axes
Pans and zooms multiple axes on the same figure, with full control of axes linking.

set x tick label in a desired format and maintain it when zooming, panning or using data cursor
Scroll bar selfadjusting on zoom and pan events.Is possible to specify a callback for axis handling

Use the mouse to seamlessly navigate a large figure

Simple template for incorporating mouse-bound axis panning in a gui.

The code calculate the regular PAL2v equations and generate the PAL2v Lattice with 12 logical states, presenting the Para-Analyzer output
GINPUT with zoom and pan
Matlab GUI which implements Zafar's audio player (Zap), featuring some practical functionalities such as a playback line, a select/drag tool
Date formatted tick labels, auto updated when zoomed or panned with Day of Year formats added.
You can also select a web site from the following list
Americas
- América Latina (Español)
- Canada (English)
- United States (English)
Europe
- Belgium (English)
- Denmark (English)
- Deutschland (Deutsch)
- España (Español)
- Finland (English)
- France (Français)
- Ireland (English)
- Italia (Italiano)
- Luxembourg (English)
- Netherlands (English)
- Norway (English)
- Österreich (Deutsch)
- Portugal (English)
- Sweden (English)
- Switzerland
- United Kingdom(English)
Asia Pacific
- Australia (English)
- India (English)
- New Zealand (English)
- 中国
- 日本Japanese (日本語)
- 한국Korean (한국어)