54 results

Quiver (vector) with a reference vector or color code on a map or Cartesian axes.
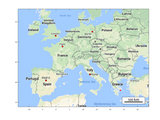
Plot a google map on the background of the current figure using the Static Google Maps API.

Various plotting/drawing functions that can be saved as KML output, and loaded in Google Earth

Break up a RINEX GPS file by a length of time

Example of creating a 3D textured Earth globe
Functions for computing and visualizing upslope area, influence map, dependence map

OpenSees toolbox
Least Squares Collocation - data interpolation, empricial covariance estimation & function fitting
Read SAC files directly into MATLAB data structures.

Plots climatic data of Temperature and Relative Humidity in a psychrometric chart.

Plot which shows relationship between wavelength, wave period and water depth.
Two Matlab functions to extract the data from two global topographic data base, ETOPO2v2 and GEOBEC.
Test two matrices (DEMs) for systematic shift / misregistration

Import Arc/Info AsciiRaster
Downloads AIRS files from DAAC.
A collection of functions to read GRIB and netCDF files

Release 6.1925 of a collection of functions for analysis/display of seismic and well-log data.
Write a 2D or 3D array to a single or multi-band GeoTIFF file
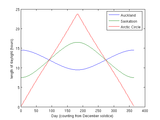
Calculates the length of daylight for any day and latitude
Date vectors converted to day of the year.
Gaussian Plume model of airborne particulate distribution
This is utility to read SAC (Seismic Analysis Code) binary files created on/for SUN platform.
Sediment Transport Outside the Surf Zone Model.
Normal gravity value of a point on Geodetic Reference System 1980.

Calculates melt for a DEM based on positive degree days factor
Companion Software

Flow accumulation algorithm that routes through flats

plotting a map with political boundaries
Performs network environ analysis on network models of energy-matter flow and storage.

Draws a satellite view of earth scaled to match the WGS84 ellipsoid, with political boundaries.
Interpolates scattered data and saves the result to a vtk file.

gravity unit converter with GUI

Great circle drawer in the lower sphere.
A script for generation of an ASCII File (Report) containing Sun Azimuth Data.

Loading Google maps in Matlab.

Draws lines of force of a magnetic dipole field in 2 and 3D.
Convert geographic coordinates to EASE-Grid projection.
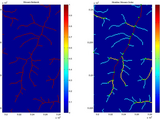
returns the Strahler Stream Order based on channel and flow direction matrix
solar software for estimating solar and collector parameter
Calculates a weight matrix of any size using the (inverse) euklidean distance from center cell.

Get tiles from nearmap or google and returns a single composite image

ploting Climentine topo data topogrd2.dat
Finds most likely locations for water channels given a potential
Granule and GMT for lat/lon sounding.
Fast convolution of AIRS radiances.
Retrieves weather data from National Weather Service Server.
Shepard ternary plot for sand, silt, clay distributions

InterpolationGstat performs inverse distance or kriging interpolation using gstat.
reading ascii files
This script applies the Maximum Correlation Cross on SST images, to estimate the superficial ocean c
dmgps sets the design matrix of a GPS network whose baselines are definable.
Weights and abscissae for radiance-to-flux conversion

Simple, robust gridding using inverse-distance interpolation.
You can also select a web site from the following list
Americas
- América Latina (Español)
- Canada (English)
- United States (English)
Europe
- Belgium (English)
- Denmark (English)
- Deutschland (Deutsch)
- España (Español)
- Finland (English)
- France (Français)
- Ireland (English)
- Italia (Italiano)
- Luxembourg (English)
- Netherlands (English)
- Norway (English)
- Österreich (Deutsch)
- Portugal (English)
- Sweden (English)
- Switzerland
- United Kingdom(English)
Asia Pacific
- Australia (English)
- India (English)
- New Zealand (English)
- 中国
- 日本Japanese (日本語)
- 한국Korean (한국어)