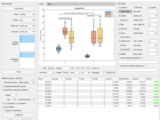
Main features:
Reads data from tables stored in .mat files
Reads data from tables stored in .xlsx files (one table per sheet)
Data loaded is shown within the app in a table
Boxplots are organized by conditions and coloured by groups
User is able to dinamically select groups and conditions from table columns
High customization (e.g. scatter, jitter, transparency, outliers, mean, group linking lines)
Easily pickable colours and color maps
Plot can be opened as a separate figure for further customization
Anova and post-hoc test performed between groups and/or conditions
Statistical results shown in a table with significant values highlighted
Significance symbols (asteriscs/bullets) can be automatically added to the plot at customizable y positions
Carlos Borau (2021). BoxPlotPro (https://www.mathworks.com/matlabcentral/fileexchange/88733-boxplotpro), MATLAB Central File Exchange. Retrieved .
Inspired by: daboxplot, copyUIAxes
Find the treasures in MATLAB Central and discover how the community can help you!
Start Hunting!Create scripts with code, output, and formatted text in a single executable document.
Hi Thorsten, thanks for your suggestion. I've added the requested feature (the user can type the number) and actually set the parameter to 1.5 by default.
I think I found the "problem". Could you add a tab to change the whisker coefficient from 1 to 1.5?
Hi Carlos, very nice App. Unfortunately, I have the problem that some points marked as outliers, which are not. When I plot them with boxplot(x,y) they are in the whiskers, when I use the app, they are not. Can you help me with this issue?
Hello Anu, what Matlab version are you using? if it is older than 2020a it might have issues with the GridLayout properties. I will revise the compatibility
for some reason it doesnt seem to work (I installed it as an app). I get this message
Error using matlab.ui.container.GridLayout/set.ColumnWidth (line 111)
'ColumnWidth' must be a cell array containing numbers, or numbers paired
with 'x' characters. You can specify any combination of values (e.g.,
{100,200,'1x','2x'}).
Error in BoxPlotPro/createComponents (line 845)
app.GridLayout2.ColumnWidth = {'fit', '1x'};
Error in BoxPlotPro (line 1523)
createComponents(app)
Error in BoxPlotProApp/startApp (line 86)
obj.AppHandle = eval('BoxPlotPro');
Error in BoxPlotProApp (line 48)
startApp(obj)
Error in appinstall.internal.runapp>execute (line 116)
out = evalin('caller', [script ';']);
Error in appinstall.internal.runapp>runapp13a (line 95)
outobj = execute(fullfile(appinstalldir, [wrapperfile 'App.m']));
Error in appinstall.internal.runapp>preamble18b (line 60)
appobj = runapp13a(appinstalldir);
Error in appinstall.internal.runapp (line 13)
out = preamble18b(appinstalldir);
Error in matlab.apputil.run (line 45)
appinstall.internal.runapp(appName, appLocation);