Generalized SEIR Epidemic Model (fitting and computation)
A generalized SEIR model with seven states [2] is numerically implemented. The implementation is done from scratch except for the fitting, that relies on the function "lsqcurvfit". Therefore, the present implementation likely differs from the one used in ref.[2].
This Matlab implementation includes also some major differences with respect to ref. [2]. Among them is the expression of the death rate and recovery rate, which are analytical and empirical functions of the time. The idea behind this time-dependency is that the death and recovery rate should converge toward a constant value as the time increases. If the death rate is kept constant, the number of death may be overestimated. Births and natural death are not modelled here. This means that the total population, including the number of deceased cases, is kept constant. Note that ref. [2] is a preprint that is not peer-reviewed and I am not qualified enough to judge the quality of the paper.
The present submission contains:
-
A function SEIQRDP.m that is used to simulate the time histories of the infectious, recovered and dead cases (among others)
-
A function fit_SEIQRDP.m that estimates the ten parameters used in SEIQRDP.m in the least square sense.
-
One example file Documentation.mlx, which presents the numerical implementation.
-
One example file Example_province_region.mlx, which uses data collected by the Johns Hopkins University for the COVID-19 epidemy [3] for Hubei province (China).
-
One example file Example_Country.mlx, which uses data collected by the Johns Hopkins University for the COVID-19 epidemy [3] for a coutnry.
-
One file "ItalianRegions.mlx" written by Matteo Secli (https://github.com/matteosecli) that I have modified for a slightly more robust fitting.
-
One example file ChineseProvinces.mlx, which illustrates how the function fit_SEIQRDP.m is used in a for loop to be fitted to the data [3] from the different Chinese provinces.
-
One example "uncertaintiesIssues.mlx", which illustrates the danger of fitting limited data sets.
-
One example "Example_US_cities.mlx" that illustrates the fitting when "recovered" data are not available.
-
One example simulateMultipleWaves,mlx that illustrates the fitting for multiple epidemic waves.
-
One function getDataCOVID, which read from [3] the data collected by Johns Hopkins University.
-
One function getDataCOVID_ITA written by Matteo Secli (https://github.com/matteosecli), that collects the updated data of the COVID-19 pandemic in Italy from the Italian government [4]
-
One function getDataCOVID_US that collects the updated data in the USA from [3]
-
One function checkRates.m that plots the fitted and computed death and recovery rates (quality check)
-
One function getMultipleWaves.m that simulate and fit the SEIRQDP model to the situations where multiple epidemic waves are detected.
Any question, comment or suggestion is welcome.
[2] Peng, L., Yang, W., Zhang, D., Zhuge, C., & Hong, L. (2020). Epidemic analysis of COVID-19 in China by dynamical modeling. arXiv preprint arXiv:2002.06563.
[3] https://github.com/CSSEGISandData/COVID-19
[4] https://github.com/pcm-dpc/COVID-19
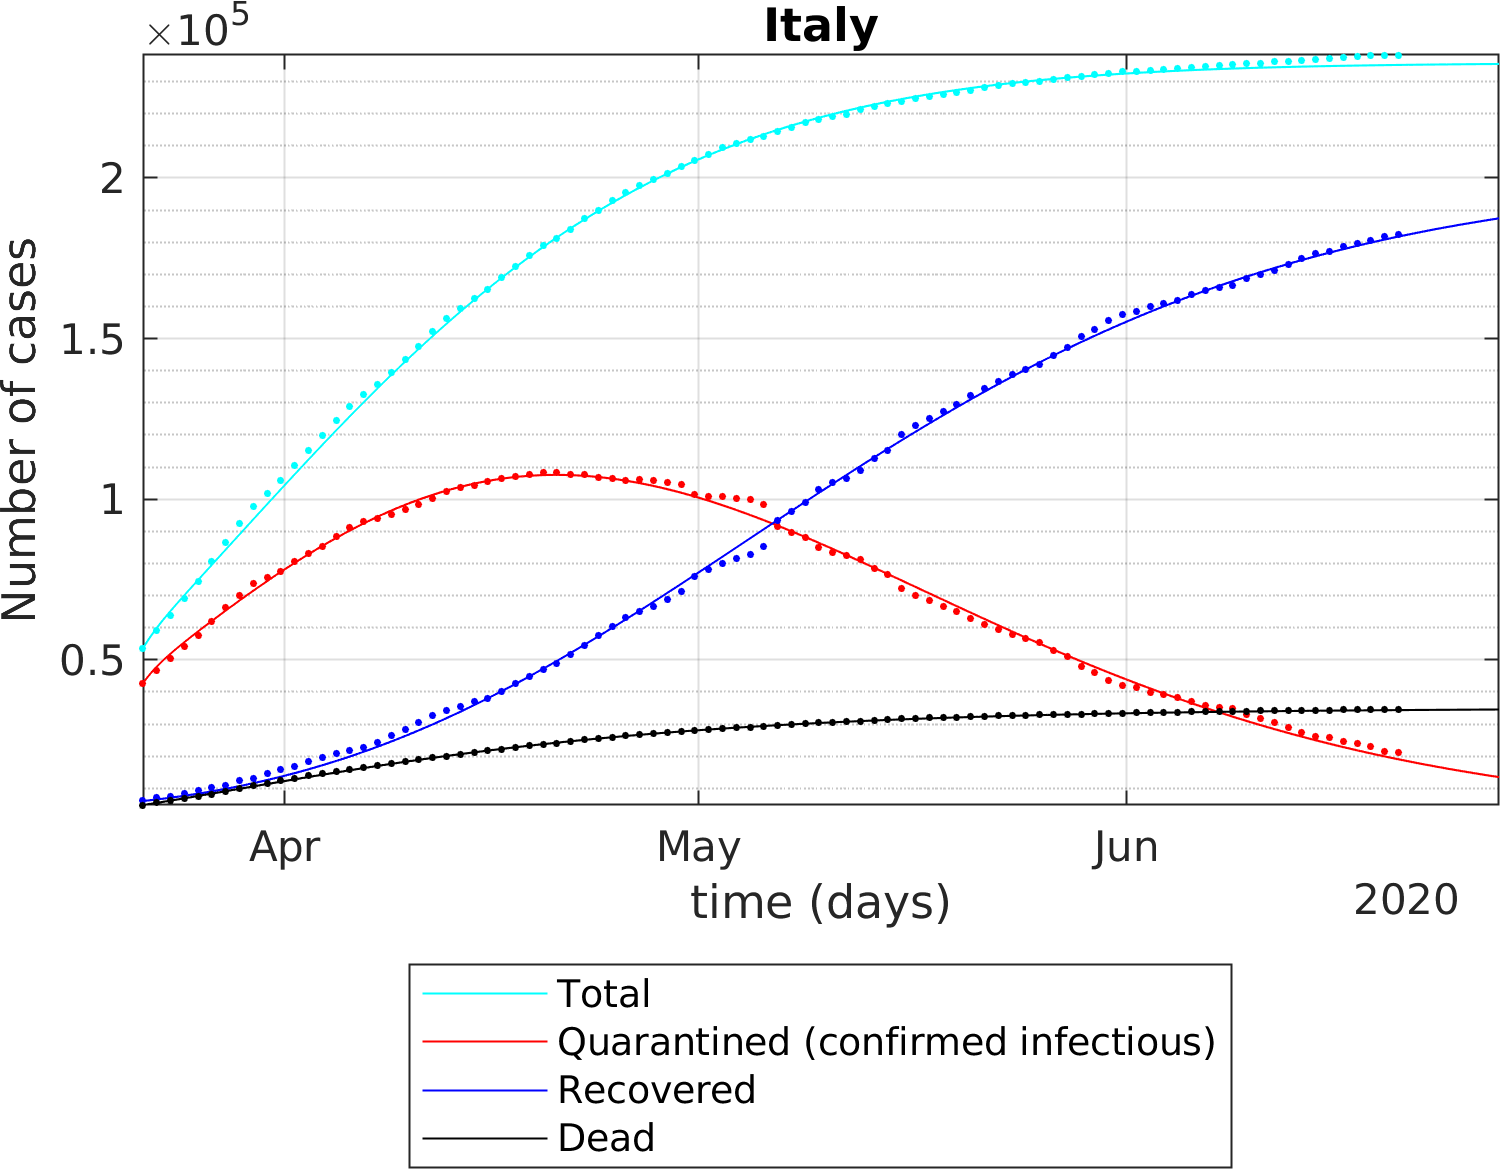
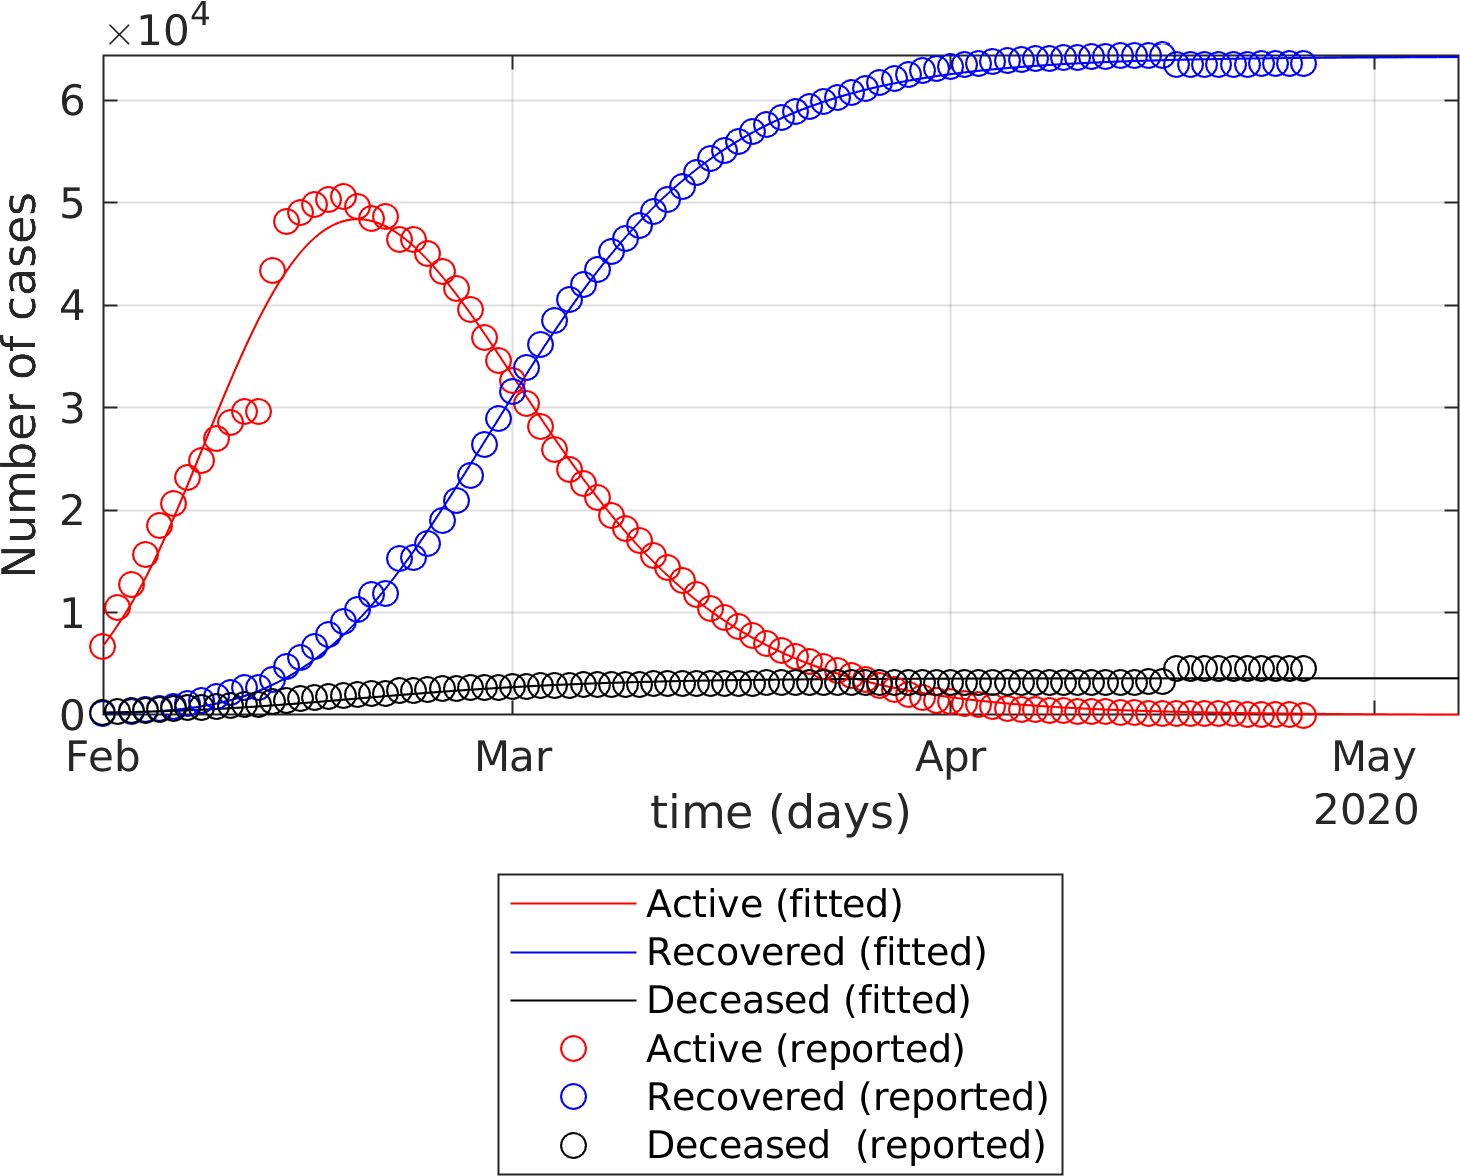
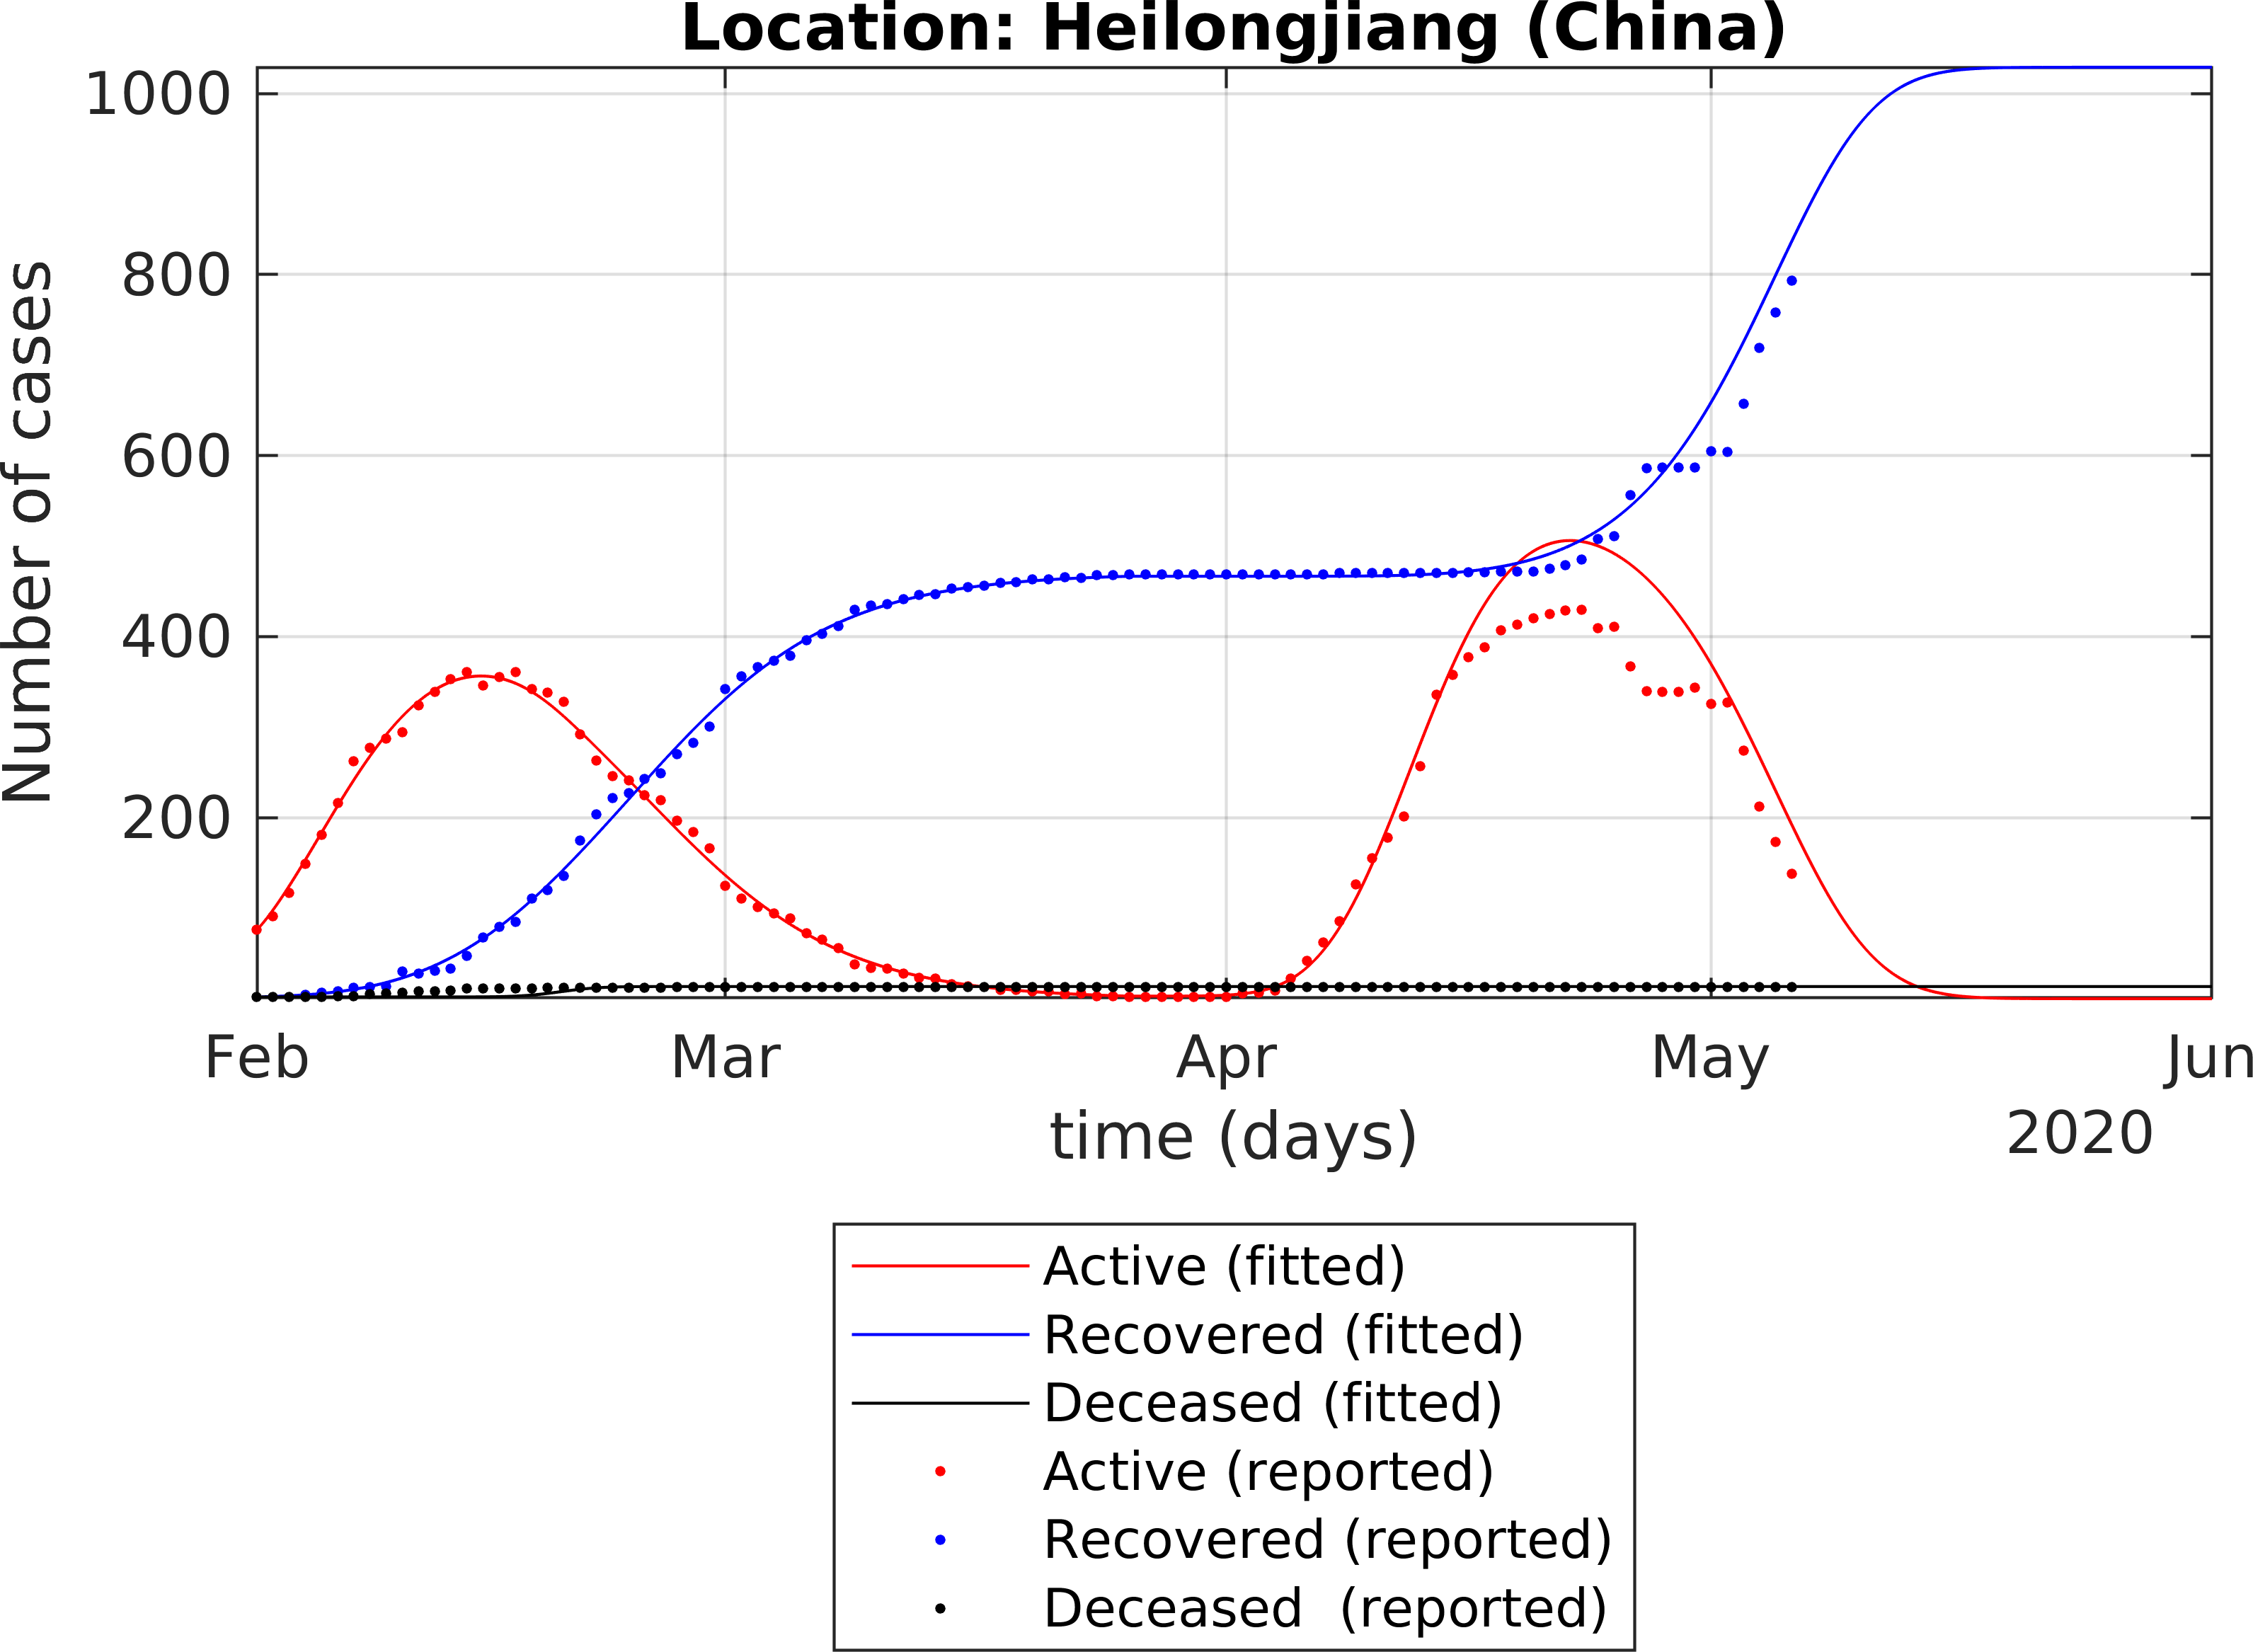
The fitting of the extended SEIR model to real data provides the following results:
The fitting of the extended SEIR model to real data provides the following results:
The fitting of the extended SEIR model to real data provides the following results:
Cite As
Cheynet, E. Generalized SEIR Epidemic Model (Fitting and Computation). Zenodo, 2020, doi:10.5281/ZENODO.3911854.
MATLAB Release Compatibility
Platform Compatibility
Windows macOS LinuxCategories
- Sciences > Biological and Health Sciences >
- Mathematics and Optimization > Optimization Toolbox > Problem-Based Optimization Setup >
- Sciences > Biological and Health Sciences > Epidemiology >
Tags
Community Treasure Hunt
Find the treasures in MATLAB Central and discover how the community can help you!
Start Hunting!Discover Live Editor
Create scripts with code, output, and formatted text in a single executable document.
Versions that use the GitHub default branch cannot be downloaded
| Version | Published | Release Notes | |
|---|---|---|---|
| 4.8.8 | See release notes for this release on GitHub: https://github.com/ECheynet/SEIR/releases/tag/v4.8.8 |
||
| 4.8.7 | See release notes for this release on GitHub: https://github.com/ECheynet/SEIR/releases/tag/v4.8.7 |
||
| 4.8.6 | See release notes for this release on GitHub: https://github.com/ECheynet/SEIR/releases/tag/v4.8.6 |
||
| 4.8.4 | See release notes for this release on GitHub: https://github.com/ECheynet/SEIR/releases/tag/v4.8.4 |
||
| 4.8.3 | See release notes for this release on GitHub: https://github.com/ECheynet/SEIR/releases/tag/v4.8.3 |
||
| 4.8.2 | See release notes for this release on GitHub: https://github.com/ECheynet/SEIR/releases/tag/v4.8.2 |
||
| 4.8.1 | See release notes for this release on GitHub: https://github.com/ECheynet/SEIR/releases/tag/v4.8.1 |
||
| 4.8 | See release notes for this release on GitHub: https://github.com/ECheynet/SEIR/releases/tag/v4.8 |
||
| 4.7 | See release notes for this release on GitHub: https://github.com/ECheynet/SEIR/releases/tag/v4.7 |
||
| 4.6 | See release notes for this release on GitHub: https://github.com/ECheynet/SEIR/releases/tag/v4.6 |
||
| 4.5 | See release notes for this release on GitHub: https://github.com/ECheynet/SEIR/releases/tag/v4.5 |
||
| 4.4 | See release notes for this release on GitHub: https://github.com/ECheynet/SEIR/releases/tag/v4.4 |
||
| 4.3 | See release notes for this release on GitHub: https://github.com/ECheynet/SEIR/releases/tag/v4.3 |
||
| 4.2 | See release notes for this release on GitHub: https://github.com/ECheynet/SEIR/releases/tag/v4.2 |
||
| 4.1 | See release notes for this release on GitHub: https://github.com/ECheynet/SEIR/releases/tag/v4.1 |
||
| 4.0 | See release notes for this release on GitHub: https://github.com/ECheynet/SEIR/releases/tag/v4.0 |
||
| 3.6 | A bug was found when calling the function "strfind", which is only used when the function "contains" is not available. The bug should be now corrected. |
|
|
| 3.5 | Summary updated |
|
|
| 3.4 | Description updated |
|
|
| 3.3 | Improved fitting for the case where only the sum "recovered + quarantined" is known. See the example with the cities in the US. |
|
|
| 3.2 | Added example file with US data when the fitting need to be applied without knowledge of the "recovered" cases + I have written "Active" cases rather than "confirmed" to avoid any confusion with the number of "tested positive" |
|
|
| 3.1 | Added an example for french regions. However, the data quality is not as good as expected. |
|
|
| 3.0 | The new database by John Hopkins University is now used. |
|
|
| 2.3 | Added one example file "uncertaintiesIssues.mlx" illustrating the danger of fitting limited data sets. + Some optional output for the function fit_SEIQRDP.m are now provided. |
|
|
| 2.2.2 | To avoid using the financial toolbox, the portion of the code "datenum(today)" was replaced with "floor(datenum(now)" |
|
|
| 2.2.1 | typo |
|
|
| 2.2 | An additional example for the Italian regions (credit to https://github.com/matteosecli) |
|
|
| 2.1 | correction of a minor bug in getDataCOVID.m that raised an error for Matlab version < R2019b |
|
|
| 2.0 | A new function is introduced to download directly the up-to-date data from https://github.com/CSSEGISandData/COVID-19 |
|
|
| 1.10.1 | Description updated |
|
|
| 1.10 | Added an optional argument in the function fit_SEIQRDP.m to choose the tolerance for the fitting and to hide the iterations, which can be annoying. Added an example file to shows how the fitting is applied iteratively to multiple locations |
|
|
| 1.9.2 | Minor preformance improvement in SEIQRDP.m |
|
|
| 1.9.1 | typos |
|
|
| 1.9 | Description updated |
|
|
| 1.8 | - New example file added (Italy) and more exhaustive database
|
|
|
| 1.7 | Description updated (8 parameters are used after version 1.2 instead of six parameters) |
|
|
| 1.6 | A possible error has been spotted in Example 2: I was using as input the number of "confirmed case", which should be interpreted as the number of quarantined cases instead of the number of "infectious cases". |
|
|
| 1.5 | Added Github repository |
|
|
| 1.4.2 | Some typos (again!) |
||
| 1.4.1 | typos |
||
| 1.4 | The description of the numerical method is done in Example1.mlx
|
||
| 1.3.3 | typos |
||
| 1.3.2 | Description |
||
| 1.3.1 | Description updated |
||
| 1.3 | Description updated |
||
| 1.2 | The death rate is now a decreasing function of the time while the recovery rate is increasing with time. |
||
| 1.1 | Corrected the population number in example 2 |
||
| 1.0.4 | Title updated |
||
| 1.0.3 | Description updated |
||
| 1.0.2 | Title updated |
||
| 1.0.1 | Description updated |
||
| 1.0.0 |


