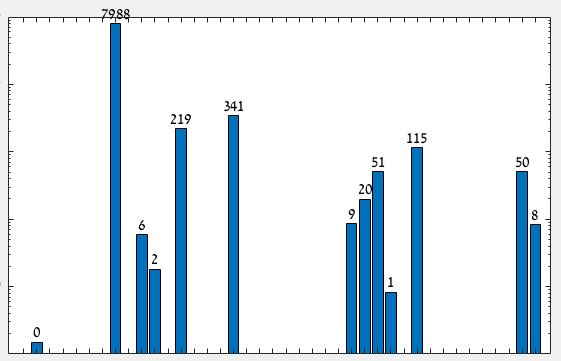
barvalues(h, precision, textParams)
Display bar values on-top of bars in a bar or histogram plot .

You are now following this Submission
- You will see updates in your followed content feed
- You may receive emails, depending on your communication preferences
Cite As
Elimelech Schreiber (2026). barvalues(h, precision, textParams) (https://github.com/lemelech/matlab-barvalues/releases/tag/2.3), GitHub. Retrieved .
General Information
- Version 2.3.0 (3.7 KB)
-
 View License on GitHub
MATLAB Release Compatibility
- Compatible with any release
Platform Compatibility
- Windows
- macOS
- Linux
| Version | Published | Release Notes | Action |
|---|---|---|---|
| 2.3.0 | See release notes for this release on GitHub: https://github.com/lemelech/matlab-barvalues/releases/tag/2.3 |
||
| 2.2.1 | See release notes for this release on GitHub: https://github.com/lemelech/matlab-barvalues/releases/tag/2.2.1 |
||
| 2.2.0 | Supports Horizontal bars.
|
||
| 2.1.0 | stabilized. |
||
| 2.0.0 | Supports all types of bars: {'stacked', 'grouped', 'hist' , 'histc'}. Now supports Histograms as well. (not fully tested, please report bugs) fixed issue: error when passed handle of stacked bar plot. (Thx Karolis) |
||
| 1.3.0 | sorry, wrong file.
|
||
| 1.2.0 | Supports multiple bar plots in single axes. |
||
| 1.1.0 | supports empty first parameter:
|
||
| 1.0.0 |

