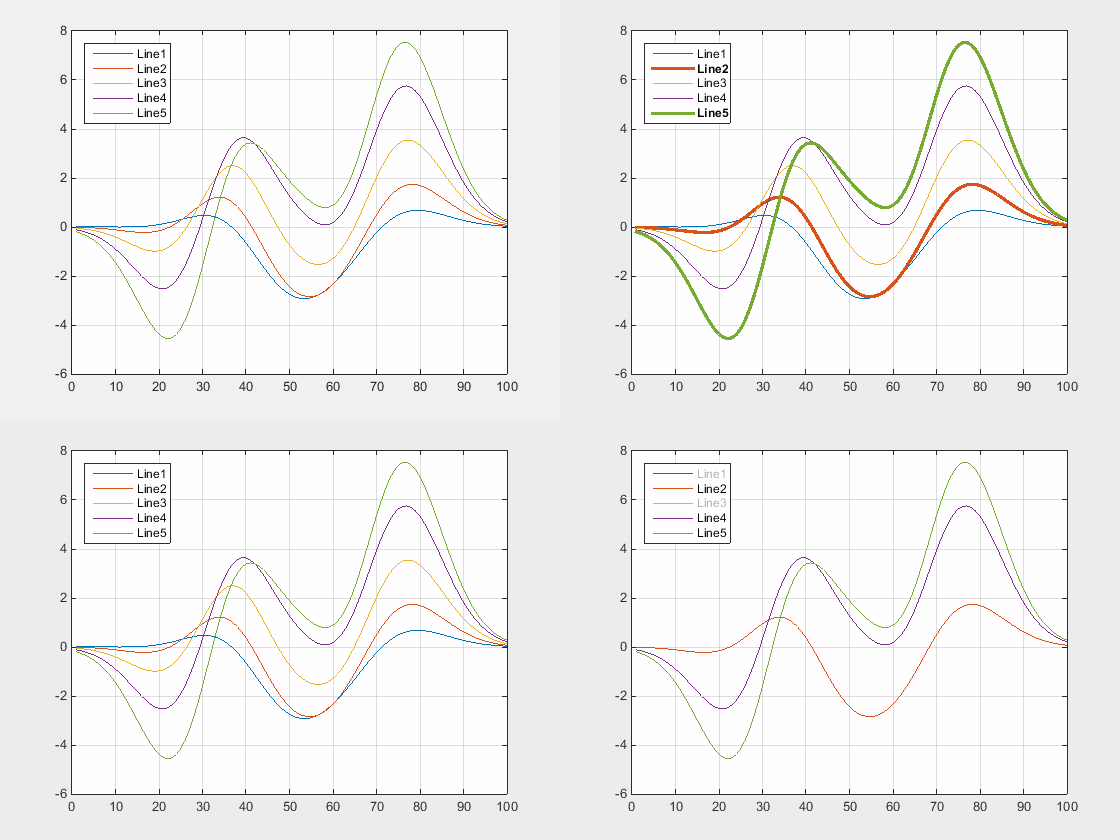
clickableLegend - Interactive highlighting of data in figures
A legend with clickable strings that let you hide and show objects in a plot.

You are now following this Submission
- You will see updates in your followed content feed
- You may receive emails, depending on your communication preferences
Editor's Note: This file was selected as MATLAB Central Pick of the Week
Cite As
Ameya Deoras (2026). clickableLegend - Interactive highlighting of data in figures (https://uk.mathworks.com/matlabcentral/fileexchange/21799-clickablelegend-interactive-highlighting-of-data-in-figures), MATLAB Central File Exchange. Retrieved .
Acknowledgements
Inspired: Fanchart - Visualize percentiles of time series data, gridLegend - a multi column format for legends
General Information
- Version 1.4.0 (262 KB)
MATLAB Release Compatibility
- Compatible with any release
Platform Compatibility
- Windows
- macOS
- Linux
| Version | Published | Release Notes | Action |
|---|---|---|---|
| 1.4.0 | Updated license |
||
| 1.4.0-0 | ClickableLegend now also highlights entries when you click them in the figure/axes window. This function is also R2014b ready |
||
| 1.2.0 | Added ability to group lines into single legend entries and specify which lines are displayed initially. |
||
| 1.0.0 |

