
Q_band_ZB_3dplot

Q_band_ZB_3dplot
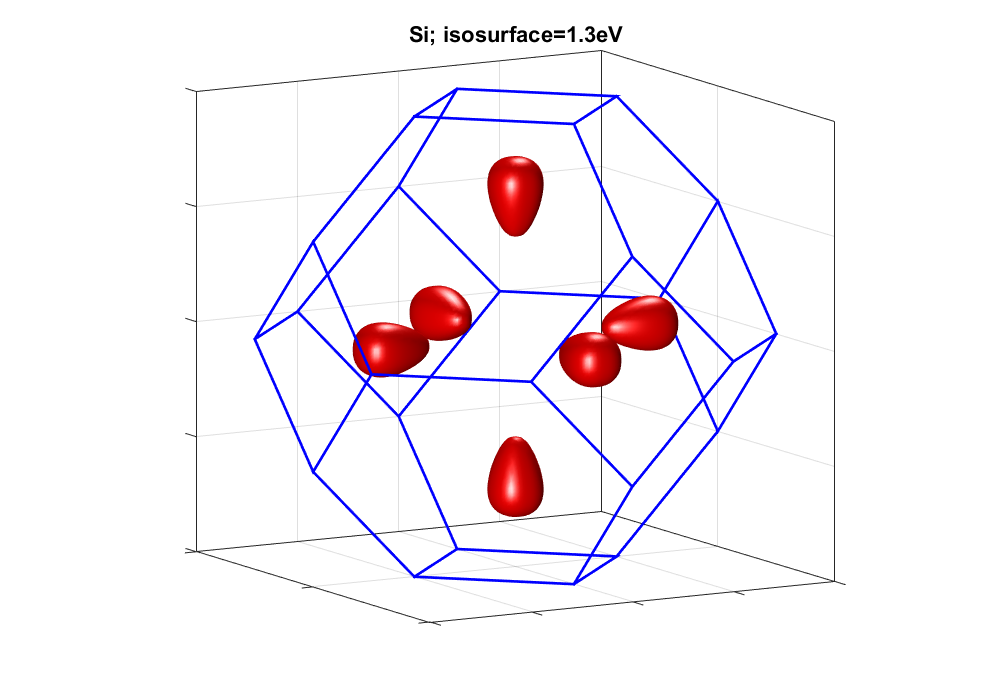
Computes and plot the electrons distribution in the ZB Brillouin zone
It uses the tight-binding model sp3s* where the parameters a from the following references:
-> for the III-V: KLIMECK et al, Superlattices and Microstructures, Vol. 27, No. 5/6, 2000
-> for Si: KLIMECK et al, Superlattices and Microstructures, Vol. 27, No. 2/3,2000
-> for Ge: VOGL et al, I. Phys. Chom. Solids Vol. 44, No. 5. pp. 365-378, 1983


Cite As
Laurent NEVOU (2026). Q_band_ZB_3dplot (https://github.com/LaurentNevou/Q_band_ZB_3dplot), GitHub. Retrieved .
MATLAB Release Compatibility
Platform Compatibility
Windows macOS LinuxTags
Discover Live Editor
Create scripts with code, output, and formatted text in a single executable document.
Versions that use the GitHub default branch cannot be downloaded
| Version | Published | Release Notes | |
|---|---|---|---|
| 1.0.1 | image updated |
|
|
| 1.0.0 |
|
You can also select a web site from the following list
Americas
- América Latina (Español)
- Canada (English)
- United States (English)
Europe
- Belgium (English)
- Denmark (English)
- Deutschland (Deutsch)
- España (Español)
- Finland (English)
- France (Français)
- Ireland (English)
- Italia (Italiano)
- Luxembourg (English)
- Netherlands (English)
- Norway (English)
- Österreich (Deutsch)
- Portugal (English)
- Sweden (English)
- Switzerland
- United Kingdom (English)
Asia Pacific
- Australia (English)
- India (English)
- New Zealand (English)
- 中国
- 日本Japanese (日本語)
- 한국Korean (한국어)