Connect MATLAB Visualizations to channel
Hi, I am currently doing a parking system that able to show red colour when the parking space is filled and change to green colour when the parking space is empty. I am using Matlab visualizations because I need the same indicator to show both two colours.
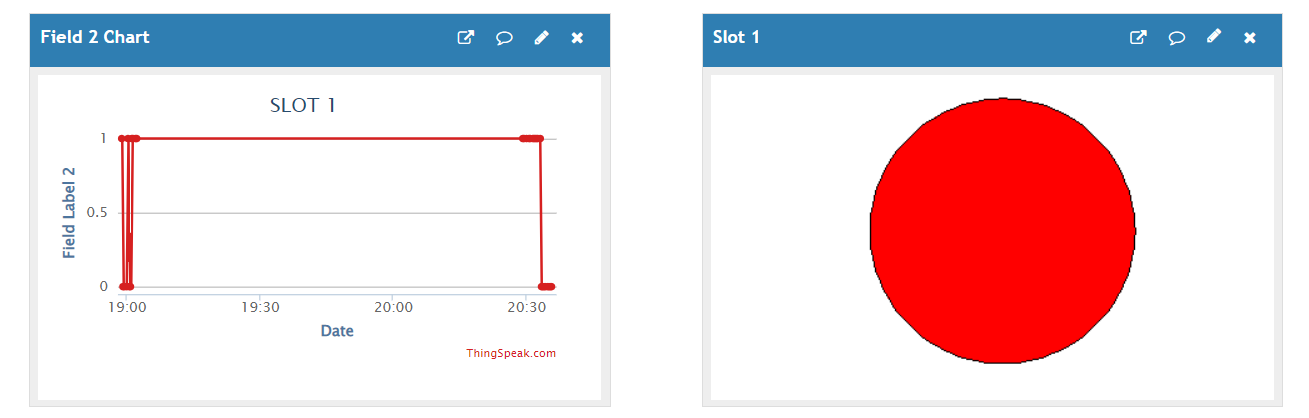
I am currently facing a problem to let the visualization change colour according to my input. Figure below show the visualization and the chart. I want the visualization able to change between green and red colour with 1 and 0 value from the chart. May I know how could I done this? Thank you.
The code for the visualization are shown below:
radius = 6;
centerX = 30;
centerY = 40;
myColor=[1 0 0];
rectangle('Position',[centerX - radius, centerY - radius, radius*2, radius*2],...
'Curvature',[1,1],'FaceColor',myColor);
axis square;
axis off;
2 Comments
Time DescendingYou might consider trying out the MATLAB onramp. Its a really good way to get going with MATLAB code. If you dont have a MATLAB license, you can use MATLAB basic free for a limited time per month (I think its 20 hours). That way you can test out the code in a full fledged IDE.
Also, you will get a lot more help with this code if you post on MATLAB answers. See the section below the discussions area for a link to post on MATLAB answers. Its a really active community.
Thank you.
Sign in to participate