Plotting Observables in the Analyzer
Hi All,
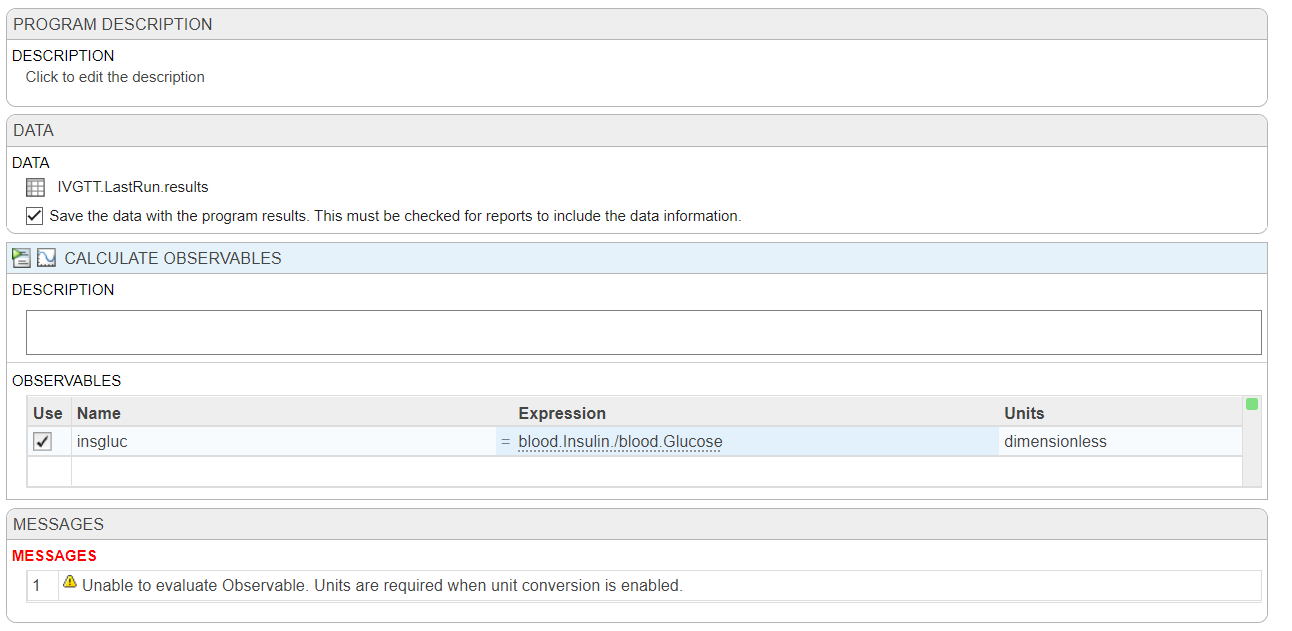
I'm trying to plot my observables in the analyzer and running into far more problems than expected. I have two species in my model that are invovled, blood.Insulin (pM) and blood.Glucose (mM), all I want to do is plot the ratio of these two (blood.Insulin/blood.Glucose (dimensionless)) along with my other species in Model Simulation, to compare it to the same ratio from my data.
First, there doesn't seem to be a way to directly add an observable to the logged states in 'Simulate Model', so I've tried to used 'Calculate Observable' based on the data from my last run (IVGTT.LastRun.results) but it says that units are required when unit conversion is enabled, but it should be dimensionless!
My next idea would be to make a non-constant parameter with a repeated assignment, but I feel like I should be able to do this without resorting to that?
Any help or ideas would be appreciated. Thank you, best regards,
Dan
1 Comment
Time DescendingHi, Dan,
I'm sorry that you have been running into issues trying to calculate observables. What you describe is a bug with using calculate observables program. You can work around this bug by calculating your observable as a post-processing step in your simulation/scan program.
Open your IVGTT program, then click on the green + button at the top to add steps to your program. Select Postprocessing -> Calculate observables

This will give you a Calculate Observables step directly in the original program. Any observables on the model will be shown here, and any observables added will be sync'ed back with the model.
Thank you for bringing this bug to our attention. Please reach out with any further questions.
Best,
Priya
Sign in to participate