Results for
Hello MATLAB Central community,
My name is Yann. And I love MATLAB. I also love Python ... 🐍 (I know, not the place for that).
I recently decided to go down the rabbit hole of AI. So I started benchmarking deep learning frameworks on basic examples. Here is a recording of my experiment:
Happy to engage in the debate. What do you think?
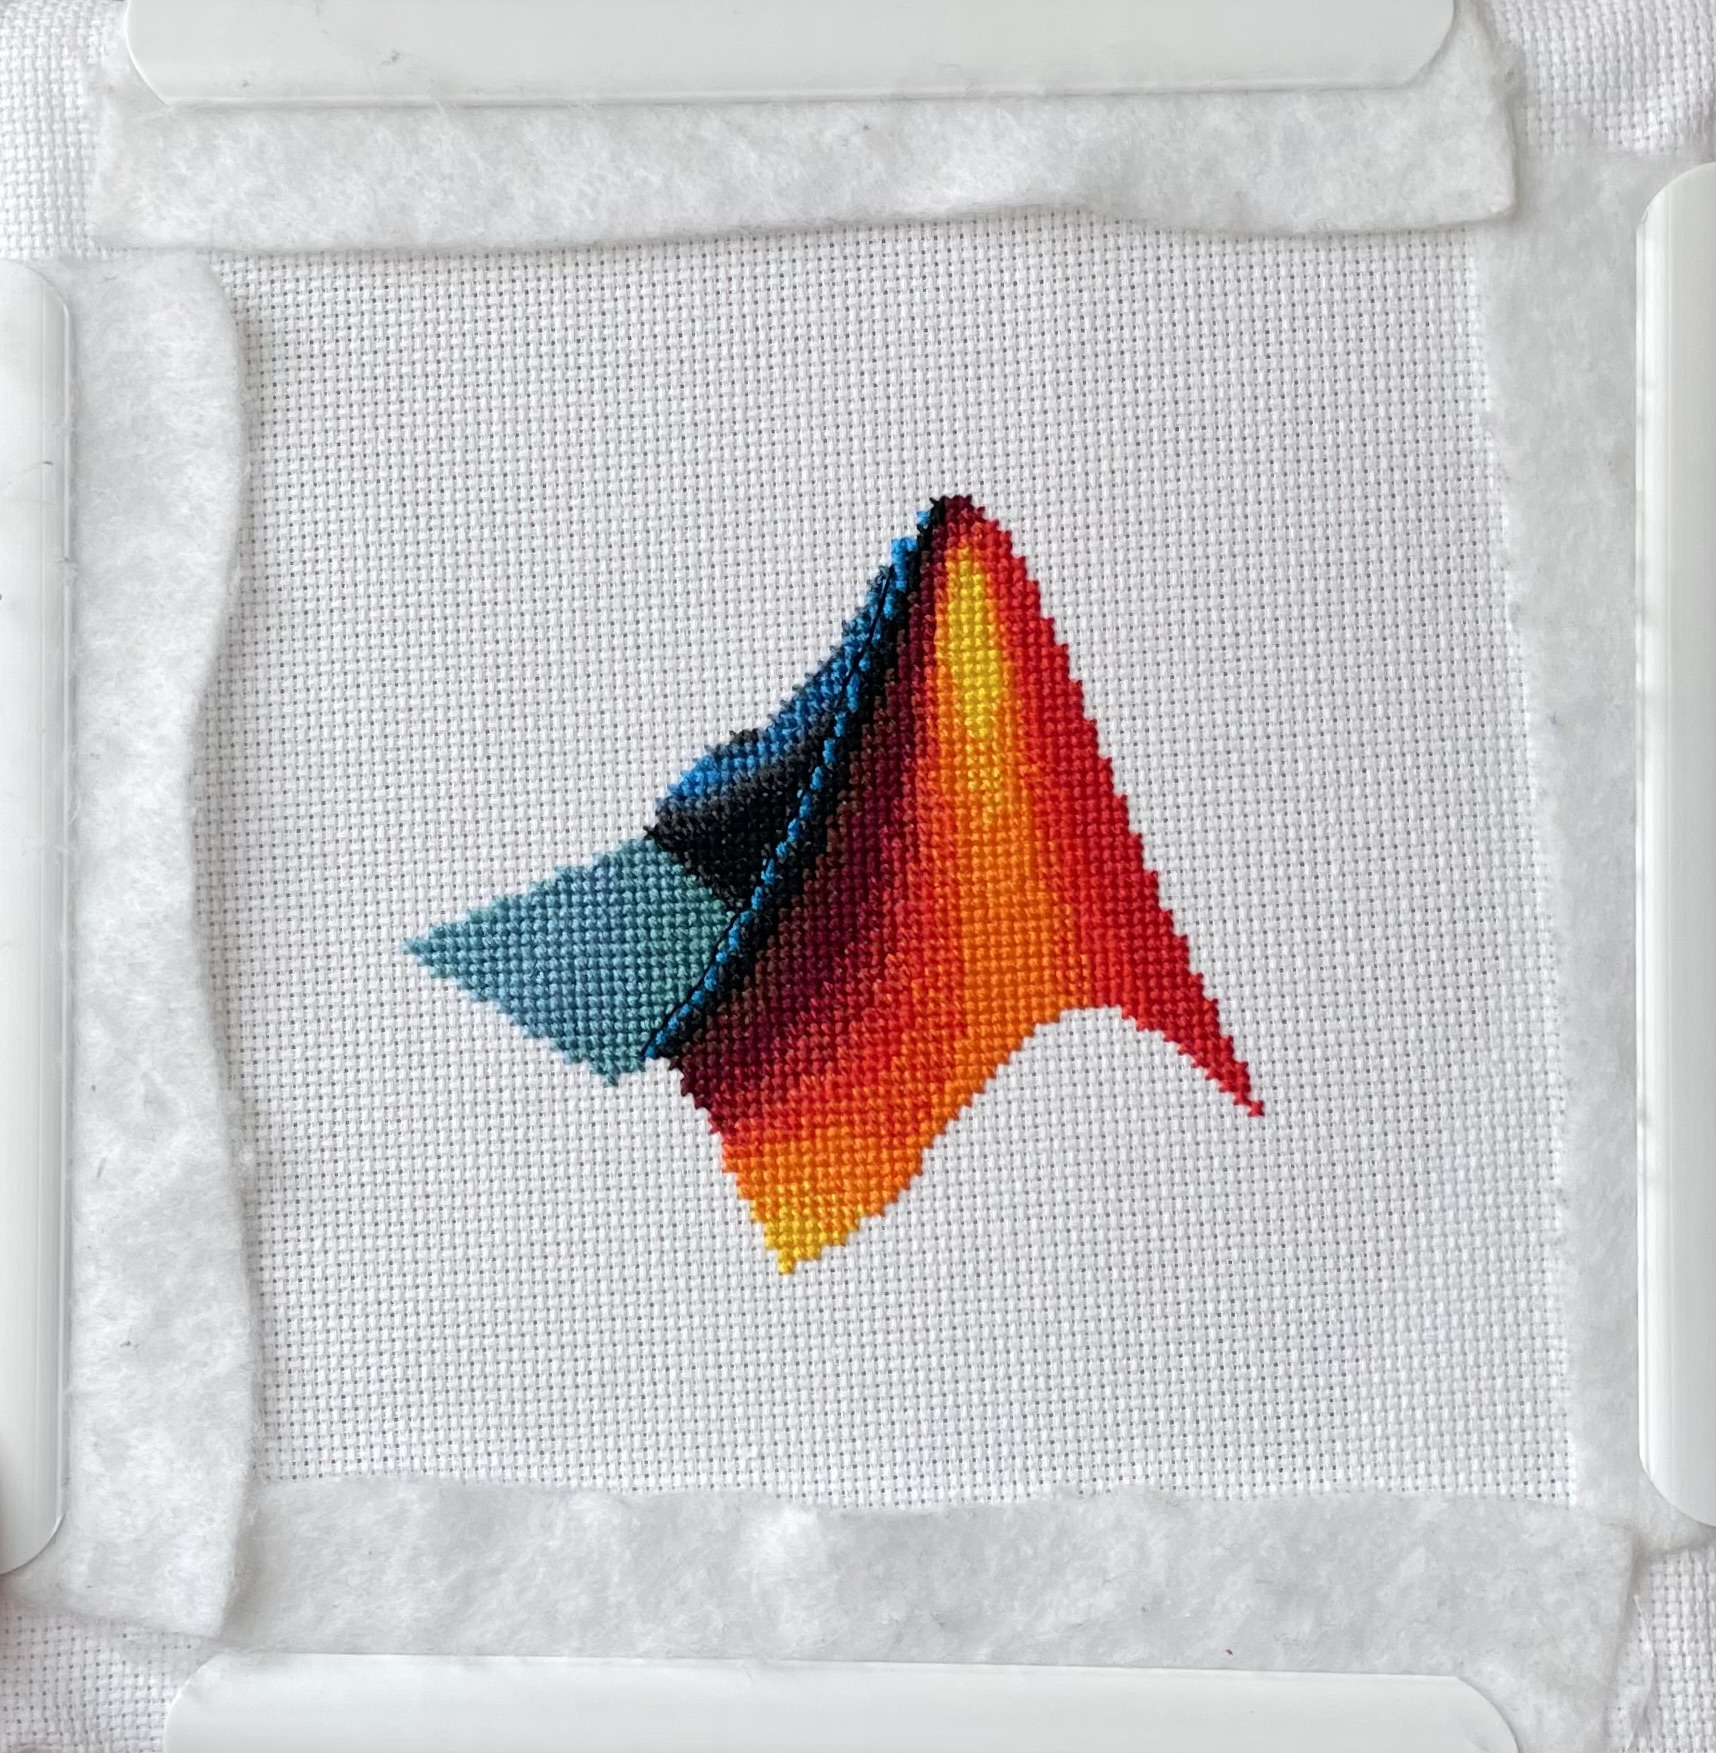
I designed and stitched this last week! It uses a total of 20 DMC thread colors, and I frequently stitched with two colors at once to create the gradient.
Large Language Models (LLMs) with MATLAB was updated again today to support the newly released OpenAI models GPT-5, GPT-5 mini, GPT-5 nano, GPT-5 chat, o3, and o4-mini. When you create an openAIChat object, set the ModelName name-value argument to "gpt-5", "gpt-5-mini", "gpt-5-nano", "gpt-5-chat-latest", "o4-mini", or "o3".
This is version 4.4.0 of this free MATLAB add-on that lets you interact with LLMs on MATLAB. The release notes are at Release v4.4.0: Support for GPT-5, o3, o4-mini · matlab-deep-learning/llms-with-matlab
Resharing a fun short video explaining what MATLAB is. :)

Hey MATLAB enthusiasts!
I just stumbled upon this hilariously effective GitHub repo for image deformation using Moving Least Squares (MLS)—and it’s pure gold for anyone who loves playing with pixels! 🎨✨
- Real-Time Magic ✨
- Precomputes weights and deformation data upfront, making it blazing fast for interactive edits. Drag control points and watch the image warp like rubber! (2)
- Supports affine, similarity, and rigid deformations—because why settle for one flavor of chaos?
- Single-File Simplicity 🧩
- All packed into one clean MATLAB class (mlsImageWarp.m).
- Endless Fun Use Cases 🤹
- Turn your pet’s photo into a Picasso painting.
- "Fix" your friend’s smile... aggressively.
- Animate static images with silly deformations (1).
Try the Demo!
You are not a jedi yet !
20%
We not grant u the rank of master !
0%
Ready are u? What knows u of ready?
0%
May the Force be with you !
80%
5 votes
I saw this on Reddit and thought of the past mini-hack contests. We have a few folks here who can do something similar with MATLAB.

I had an error in the web version Matlab, so I exited and came back in, and this boy was plotted.
It seems like the financial news is always saying the stock market is especially volatile now. But is it really? This code will show you the daily variation from the prior day. You can see that the average daily change from one day to the next is 0.69%. So any change in the stock market from the prior day less than about 0.7% or 1% is just normal "noise"/typical variation. You can modify the code to adjust the starting date for the analysis. Data file (Excel workbook) is attached (hopefully - I attached it twice but it's not showing up yet).

% Program to plot the Dow Jones Industrial Average from 1928 to May 2025, and compute the standard deviation.
% Data available for download at https://finance.yahoo.com/quote/%5EDJI/history?p=%5EDJI
% Just set the Time Period, then find and click the download link, but you ned a paid version of Yahoo.
%
% If you have a subscription for Microsoft Office 365, you can also get historical stock prices.
% Reference: https://support.microsoft.com/en-us/office/stockhistory-function-1ac8b5b3-5f62-4d94-8ab8-7504ec7239a8#:~:text=The%20STOCKHISTORY%20function%20retrieves%20historical,Microsoft%20365%20Business%20Premium%20subscription.
% For example put this in an Excel Cell
% =STOCKHISTORY("^DJI", "1/1/2000", "5/10/2025", 0, 1, 0, 1,2,3,4, 5)
% and it will fill out a table in Excel
%====================================================================================================================
clc; % Clear the command window.
close all; % Close all figures (except those of imtool.)
imtool close all; % Close all imtool figures if you have the Image Processing Toolbox.
clear; % Erase all existing variables. Or clearvars if you want.
workspace; % Make sure the workspace panel is showing.
format long g;
format compact;
fontSize = 14;
filename = 'Dow Jones Industrial Index.xlsx';
data = readtable(filename);
% Date,Close,Open,High,Low,Volume
dates = data.Date;
closing = data.Close;
volume = data.Volume;
% Define start date and stop date
startDate = datetime(2011,1,1)
stopDate = dates(end)
selectedDates = dates > startDate;
% Extract those dates:
dates = dates(selectedDates);
closing = closing(selectedDates);
volume = volume(selectedDates);
% Plot Volume
hFigVolume = figure('Name', 'Daily Volume');
plot(dates, volume, 'b-');
grid on;
xticks(startDate:calendarDuration(5,0,0):stopDate)
title('Dow Jones Industrial Average Volume', 'FontSize', fontSize);
hFig = figure('Name', 'Daily Standard Deviation');
subplot(3, 1, 1);
plot(dates, closing, 'b-');
xticks(startDate:calendarDuration(5,0,0):stopDate)
drawnow;
grid on;
caption = sprintf('Dow Jones Industrial Average from %s through %s', dates(1), dates(end));
title(caption, 'FontSize', fontSize);
% Get the average change from one trading day to the next.
diffs = 100 * abs(closing(2:end) - closing(1:end-1)) ./ closing(1:end-1);
subplot(3, 1, 2);
averageDailyChange = mean(diffs)
% Looks pretty noisy so let's smooth it for a nicer display.
numWeeks = 4;
diffs = sgolayfilt(diffs, 2, 5*numWeeks+1);
plot(dates(2:end), diffs, 'b-');
grid on;
xticks(startDate:calendarDuration(5,0,0):stopDate)
hold on;
line(xlim, [averageDailyChange, averageDailyChange], 'Color', 'r', 'LineWidth', 2);
ylabel('Percentage', 'FontSize', fontSize);
caption = sprintf('Day-to-Day Change Percentage. Average Daily Change (from prior day) = %.2f%%', averageDailyChange);
title(caption, 'FontSize', fontSize);
drawnow;
% Get the stddev over a 5 trading day window.
sd = stdfilt(closing, ones(5, 1));
% Get it relative to the magnitude.
sd = sd ./ closing * 100;
averageVariation = mean(sd)
numWeeks = 2;
% Looks pretty noisy so let's smooth it for a nicer display.
sd = sgolayfilt(sd, 2, 5*numWeeks+1);
% Plot it.
subplot(3, 1, 3);
plot(dates, sd, 'b-');
grid on;
xticks(startDate:calendarDuration(5,0,0):stopDate)
hold on;
line(xlim, [averageVariation, averageVariation], 'Color', 'r', 'LineWidth', 2);
ylabel('Percentage', 'FontSize', fontSize);
caption = sprintf('Weekly Standard Deviation, Averaged Over %d Weeks (%d trading days). Mean SD = %.2f', ...
numWeeks, 5*numWeeks+1, averageVariation);
title(caption, 'FontSize', fontSize);
% Maximize figure window.
g = gcf;
g.WindowState = 'maximized';
Large Languge model with MATLAB, a free add-on that lets you access LLMs from OpenAI, Azure, amd Ollama (to use local models) on MATLAB, has been updated to support OpenAI GPT-4.1, GPT-4.1 mini, and GPT-4.1 nano.
According to OpenAI, "These models outperform GPT‑4o and GPT‑4o mini across the board, with major gains in coding and instruction following. They also have larger context windows—supporting up to 1 million tokens of context—and are able to better use that context with improved long-context comprehension."
What would you build with the latest update?

Provide insightful answers
9%
Provide label-AI answer
9%
Provide answer by both AI and human
21%
Do not use AI for answers
46%
Give a button "chat with copilot"
10%
use AI to draft better qustions
5%
1561 votes
%% 清理环境
close all; clear; clc;
%% 模拟时间序列
t = linspace(0,12,200); % 时间从 0 到 12,分 200 个点
% 下面构造一些模拟的"峰状"数据,用于演示
% 你可以根据需要替换成自己的真实数据
rng(0); % 固定随机种子,方便复现
baseIntensity = -20; % 强度基线(z 轴的最低值)
numSamples = 5; % 样本数量
yOffsets = linspace(20,140,numSamples); % 不同样本在 y 轴上的偏移
colors = [ ...
0.8 0.2 0.2; % 红
0.2 0.8 0.2; % 绿
0.2 0.2 0.8; % 蓝
0.9 0.7 0.2; % 金黄
0.6 0.4 0.7]; % 紫
% 构造一些带多个峰的模拟数据
dataMatrix = zeros(numSamples, length(t));
for i = 1:numSamples
% 随机峰参数
peakPositions = randperm(length(t),3); % 三个峰位置
intensities = zeros(size(t));
for pk = 1:3
center = peakPositions(pk);
width = 10 + 10*rand; % 峰宽
height = 100 + 50*rand; % 峰高
% 高斯峰
intensities = intensities + height*exp(-((1:length(t))-center).^2/(2*width^2));
end
% 再加一些小随机扰动
intensities = intensities + 10*randn(size(t));
dataMatrix(i,:) = intensities;
end
%% 开始绘图
figure('Color','w','Position',[100 100 800 600],'Theme','light');
hold on; box on; grid on;
for i = 1:numSamples
% 构造 fill3 的多边形顶点
xPatch = [t, fliplr(t)];
yPatch = [yOffsets(i)*ones(size(t)), fliplr(yOffsets(i)*ones(size(t)))];
zPatch = [dataMatrix(i,:), baseIntensity*ones(size(t))];
% 使用 fill3 填充面积
hFill = fill3(xPatch, yPatch, zPatch, colors(i,:));
set(hFill,'FaceAlpha',0.8,'EdgeColor','none'); % 调整透明度、去除边框
% 在每条曲线尾部标注 Sample i
text(t(end)+0.3, yOffsets(i), dataMatrix(i,end), ...
['Sample ' num2str(i)], 'FontSize',10, ...
'HorizontalAlignment','left','VerticalAlignment','middle');
end
%% 坐标轴与视角设置
xlim([0 12]);
ylim([0 160]);
zlim([-20 350]);
xlabel('Time (sec)','FontWeight','bold');
ylabel('Frequency (Hz)','FontWeight','bold');
zlabel('Intensity','FontWeight','bold');
% 设置刻度(根据需要微调)
set(gca,'XTick',0:2:12, ...
'YTick',0:40:160, ...
'ZTick',-20:40:200);
% 设置视角(az = 水平旋转,el = 垂直旋转)
view([211 21]);
% 让三维坐标轴在后方
set(gca,'Projection','perspective');
% 如果想去掉默认的坐标轴线,也可以尝试
% set(gca,'BoxStyle','full','LineWidth',1.2);
%% 可选:在后方添加一个浅色网格平面 (示例)
% 这个与题图右上方的网格类似
[Xplane,Yplane] = meshgrid([0 12],[0 160]);
Zplane = baseIntensity*ones(size(Xplane)); % 在 Z = -20 处画一个竖直面的框
surf(Xplane, Yplane, Zplane, ...
'FaceColor',[0.95 0.95 0.9], ...
'EdgeColor','k','FaceAlpha',0.3);
%% 进一步美化(可根据需求调整)
title('3D Stacked Plot Example','FontSize',12);
constantplane("x",12,FaceColor=rand(1,3),FaceAlpha=0.5);
constantplane("y",0,FaceColor=rand(1,3),FaceAlpha=0.5);
constantplane("z",-19,FaceColor=rand(1,3),FaceAlpha=0.5);
hold off;

Have fun! Enjoy yourself!
We are excited to announce the first edition of the MathWorks AI Challenge. You’re invited to submit innovative solutions to challenges in the field of artificial intelligence. Choose a project from our curated list and submit your solution for a chance to win up to $1,000 (USD). Showcase your creativity and contribute to the advancement of AI technology.
Hi! I'm Joseff and along with being a student in chemical engineering, one of my great passions is language-learning. I learnt something really cool recently about Catalan (a romance language closely related to Valencian that's spoken in Andorra, Catalonia, and parts of Spain) — and that is how speakers tell the time.
While most European languages stick to the standard minutes-past / minutes-to between hours, Catalan does something really quite special, with a focus on the quarters (quarts [ˈkwarts]). To see what I mean, take a look at this clock made by Penguin___Lover on Instructables :
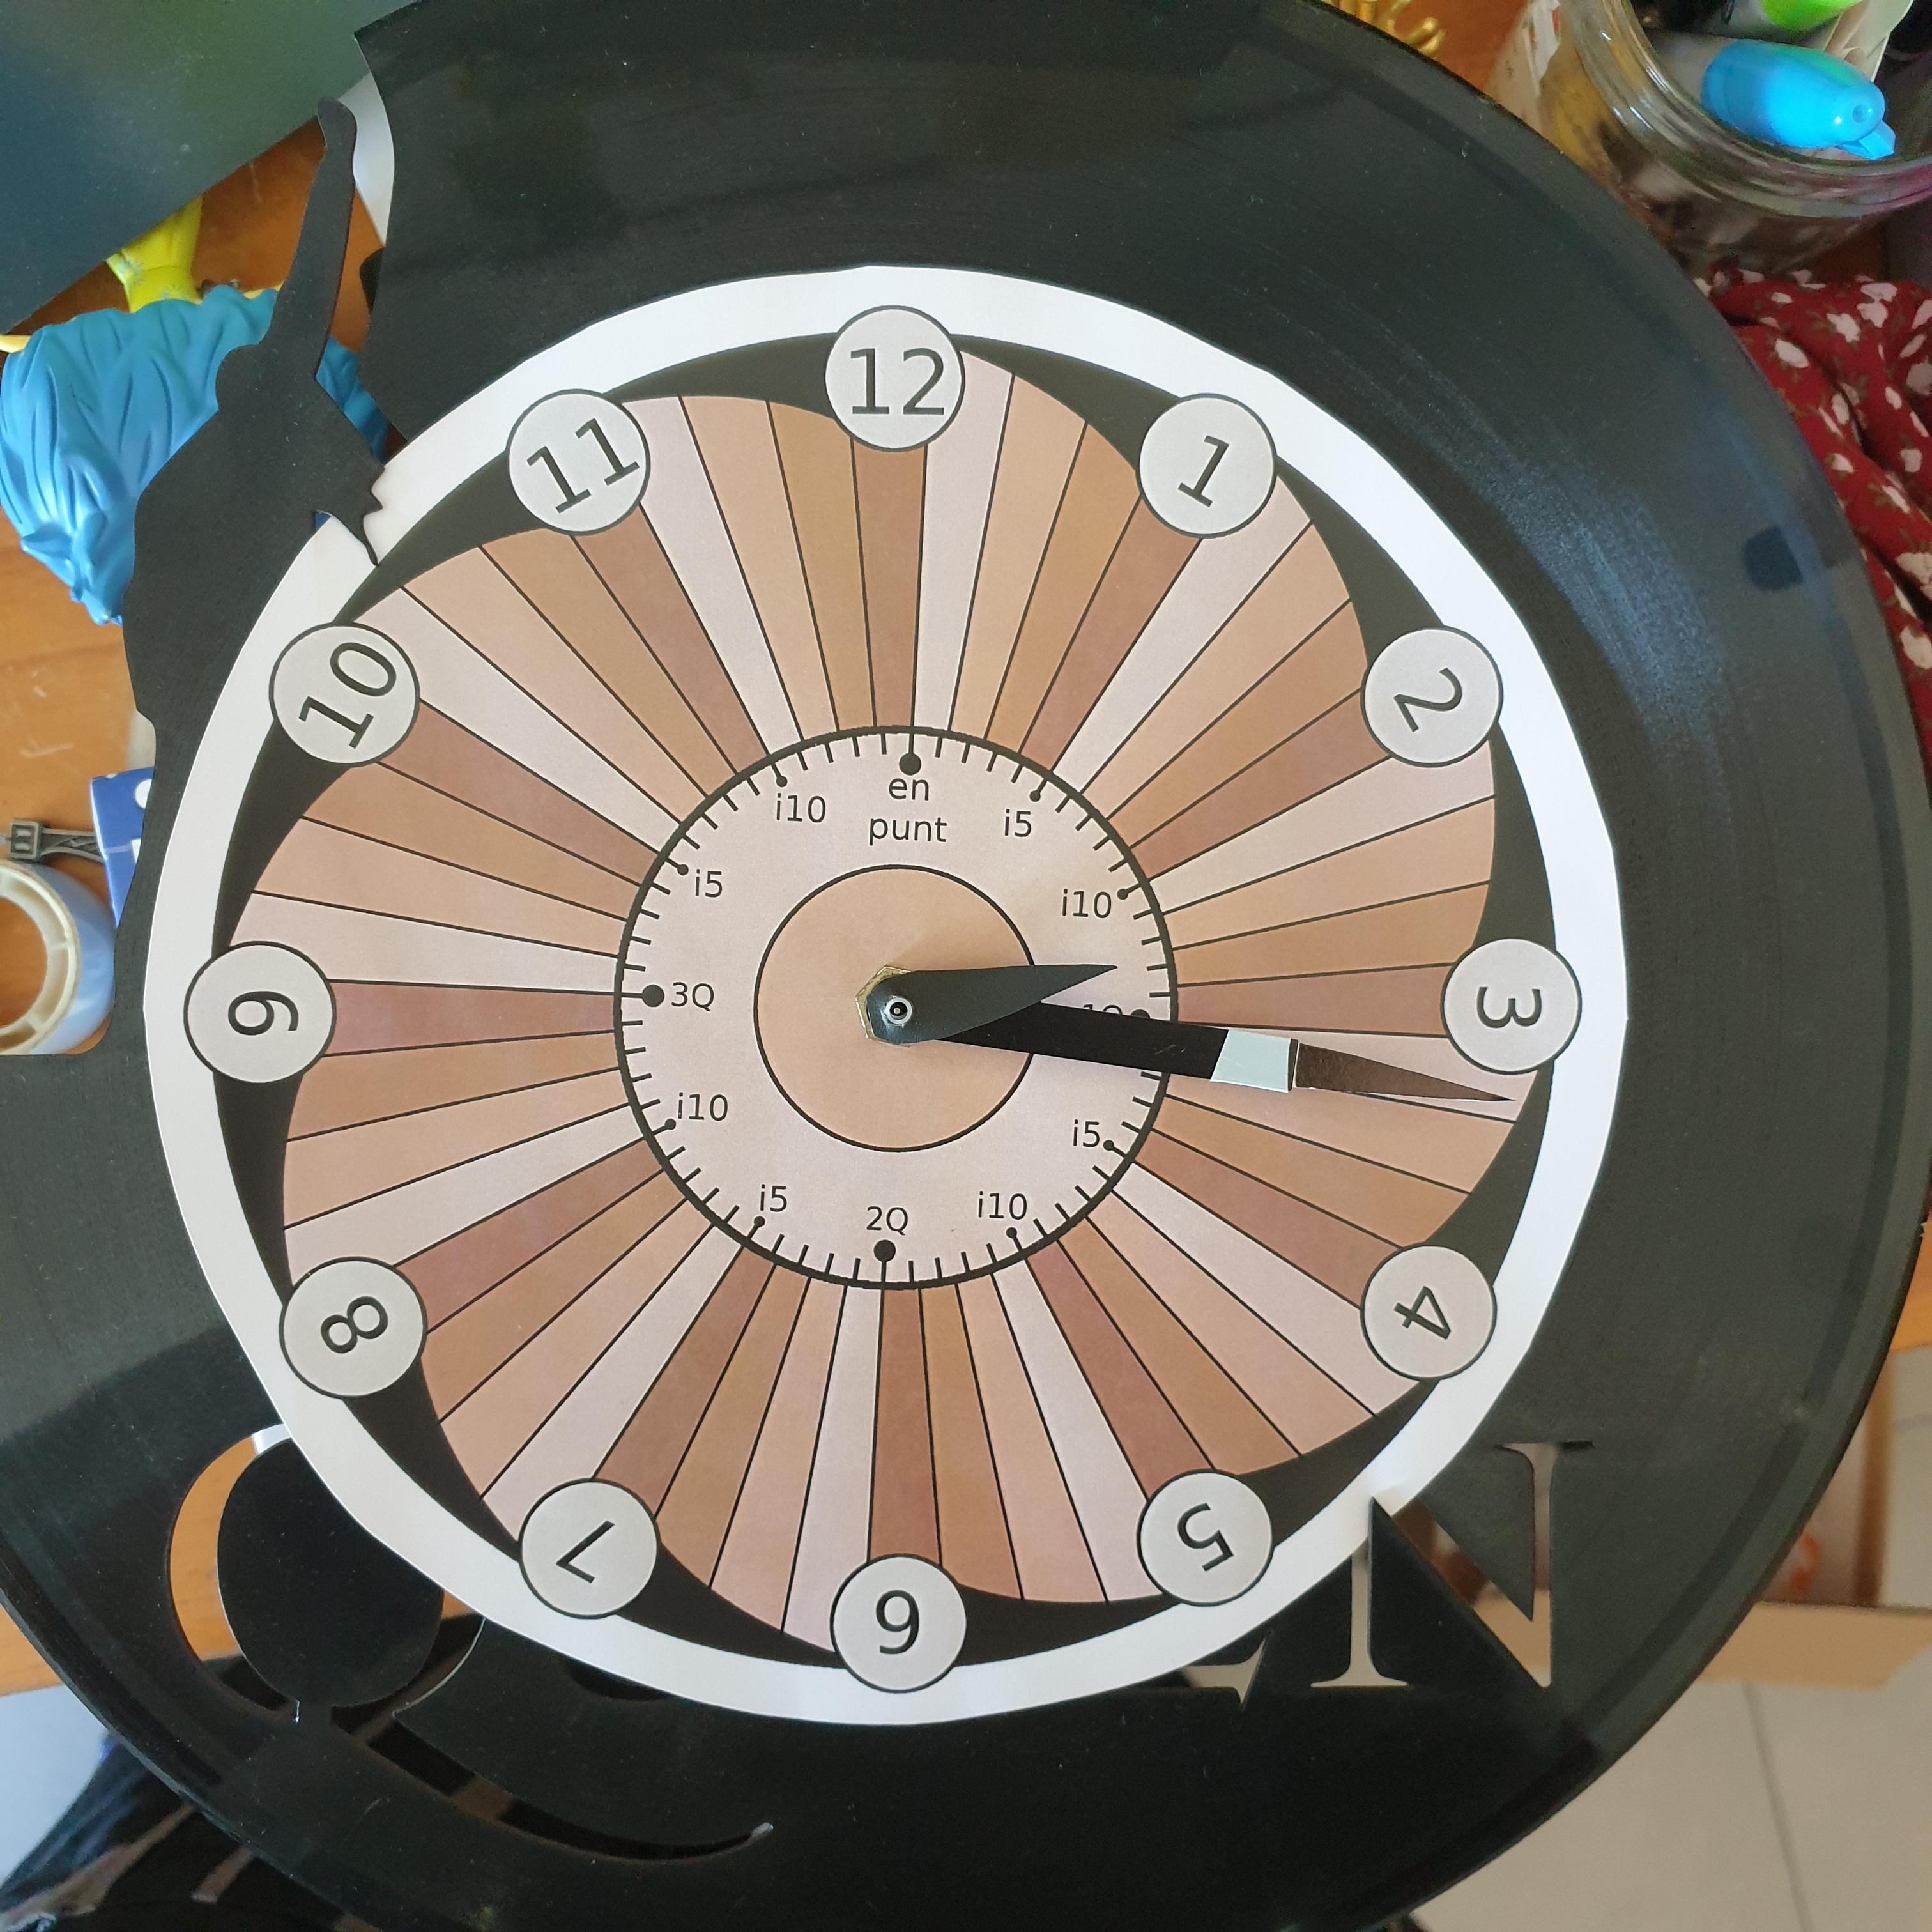
If you want to tell the time in Catalan, you should refer to the following hour (the one that's still to come), and how many minutes have passed or will pass for the closest quarter (sometimes half-quarter / mig quart [ˈmit͡ʃ kwart]) — clear as mud? It's definitely one of the more difficult things to wrap your head around as a learner. But fear not, with the power of MATLAB, we'll understand in no time!
To make a tool to tell the time in Catalan, the first thing we need to do is extract the current time into its individual hours, minutes and seconds*
function catalanTime = quinahora()
% Get the current time
[hours, minutes, seconds] = hms(datetime("now"));
% Adjust hours to 12-hour format
catalanHour = mod(hours-1, 12)+1;
nextHour = mod(hours, 12)+1;
Then to defining the numbers in catalan. It's worth noting that because the hours are feminine and the minutes are masculine, the words for 1 and 2 is different too (this is not too weird as languages go, in fact for my native Welsh there's a similar pattern between 2 and 4).
% Define the numbers in Catalan
catNumbers.masc = ["un", "dos", "tres", "quatre", "cinc"];
catNumbers.fem = ["una", "dues", "tres", "quatre",...
"cinc", "sis", "set", "vuit",...
"nou", "deu", "onze", "dotze"];
Okay, now it's starting to get serious! I mentioned before that this traditional time telling system is centred around the quarters — and that is true, but you'll also hear about the mig de quart (half of a quarter) * which is why we needed that seconds' precision from earlier!
% Define 07:30 intervals around the clock from 0 to 60
timeMarks = 0:15/2:60;
timeFraction = minutes + seconds / 60; % get the current position
[~, idx] = min(abs(timeFraction - timeMarks)); % extract the closest timeMark
mins = round(timeFraction - timeMarks(idx)); % round to the minute
After getting the fraction of the hour that we'll use later to tell the time, we can look into how many minutes it differs from that set time, using menys (less than) and i (on top of). There's also a bit of an AM/PM distinction, so you can use this function and know whether it's morning or night!
% Determine the minute string (diffString logic)
diffString = '';
if mins < 0
diffString = sprintf(' menys %s', catNumbers.masc(abs(mins)));
elseif mins > 0
diffString = sprintf(' i %s', catNumbers.masc(abs(mins)));
end
% Determine the part of the day (partofDay logic)
if hours < 12
partofDay = 'del matí'; % Morning (matí)
elseif hours < 18
partofDay = 'de la tarda'; % Afternoon (tarda)
elseif hours < 21
partofDay = 'del vespre'; % Evening (vespre)
else
partofDay = 'de la nit'; % Night (nit)
end
% Determine 'en punt' (o'clock exactly) based on minutes
enPunt = '';
if mins == 0
enPunt = ' en punt';
end
Now all that's left to do is define the main part of the string, which is which mig quart we are in. Since we extracted the index idx earlier as the closest timeMark, it's just a matter of indexing into this after the strings have been defined.
% Create the time labels
labels = {sprintf('són les %s%s%s %s', catNumbers.fem(catalanHour), diffString, enPunt, partofDay), ...
sprintf('és mig quart de %s%s %s', catNumbers.fem(nextHour), diffString, partofDay), ...
sprintf('és un quart de %s%s %s', catNumbers.fem(nextHour), diffString, partofDay), ...
sprintf('és un quart i mig de %s%s %s', catNumbers.fem(nextHour), diffString, partofDay), ...
sprintf('són dos quarts de %s%s %s', catNumbers.fem(nextHour), diffString, partofDay), ...
sprintf('són dos quarts i mig de %s%s %s', catNumbers.fem(nextHour), diffString, partofDay), ...
sprintf('són tres quarts de %s%s %s', catNumbers.fem(nextHour), diffString, partofDay), ...
sprintf('són tres quarts i mig de %s%s %s', catNumbers.fem(nextHour), diffString, partofDay), ...
sprintf('són les %s%s%s %s', catNumbers.fem(nextHour), diffString, enPunt, partofDay)};
catalanTime = labels{idx};
Then we need to do some clean up — the definite article les / la and the preposition de don't play nice with un and the initial vowel in onze, so there's a little replacement lookup here.
% List of old and new substrings for replacement
oldStrings = {'les un', 'són la una', 'de una', 'de onze'};
newStrings = {'la una', 'és la una', 'd''una', 'd''onze'};
% Apply replacements using a loop
for i = 1:length(oldStrings)
catalanTime = strrep(catalanTime, oldStrings{i}, newStrings{i});
end
end
quinahora()
So, can you work out what time it was when I made this post? 🤔
And how do you tell the time in your language?
Fins després!
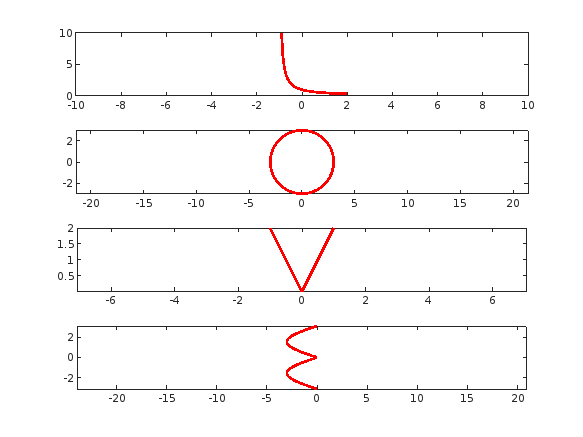
tiledlayout(4,1);
% Plot "L" (y = 1/(x+1), for x > -1)
x = linspace(-0.9, 2, 100); % Avoid x = -1 (undefined)
y =1 ./ (x+1) ;
nexttile;
plot(x, y, 'r', 'LineWidth', 2);
xlim([-10,10])
% Plot "O" (x^2 + y^2 = 9)
theta = linspace(0, 2*pi, 100);
x = 3 * cos(theta);
y = 3 * sin(theta);
nexttile;
plot(x, y, 'r', 'LineWidth', 2);
axis equal;
% Plot "V" (y = -2|x|)
x = linspace(-1, 1, 100);
y = 2 * abs(x);
nexttile;
plot(x, y, 'r', 'LineWidth', 2);
axis equal;
% Plot "E" (x = -3 |sin(y)|)
y = linspace(-pi, pi, 100);
x = -3 * abs(sin(y));
nexttile;
plot(x, y, 'r', 'LineWidth', 2);
axis equal;
Check out the result of "emoji matrix" multiplication below.
- vector multiply vector:
a = ["😁","😁","😁"]
b = ["😂";
"😂"
"😂"]
c = a*b
d = b*a
- matrix multiply matrix:
matrix1 = [
"😀", "😃";
"😄", "😁"]
matrix2 = [
"😆", "😅";
"😂", "🤣"]
resutl = matrix1*matrix2
enjoy yourself!
For Valentine's day this year I tried to do something a little more than just the usual 'Here's some MATLAB code that draws a picture of a heart' and focus on how to share MATLAB code. TL;DR, here's my advice
- Put the code on GitHub. (Allows people to access and collaborate on your code)
- Set up 'Open in MATLAB Online' in your GitHub repo (Allows people to easily run it)
I used code by @Zhaoxu Liu / slandarer and others to demonstrate. I think that those two steps are the most impactful in that they get you from zero to one but If I were to offer some more advice for research code it would be
3. Connect the GitHub repo to File Exchange (Allows MATLAB users to easily find it in-product).
4. Get a Digitial Object Identifier (DOI) using something like Zenodo. (Allows people to more easily cite your code)
There is still a lot more you can do of course but if everyone did this for any MATLAB code relating to a research paper, we'd be in a better place I think.
Here's the article: On love and research software: Sharing code with your Valentine » The MATLAB Blog - MATLAB & Simulink
What do you think?
Simulink has been an essential tool for modeling and simulating dynamic systems in MATLAB. With the continuous advancements in AI, automation, and real-time simulation, I’m curious about what the future holds for Simulink.
What improvements or new features do you think Simulink will have in the coming years? Will AI-driven modeling, cloud-based simulation, or improved hardware integration shape the next generation of Simulink?
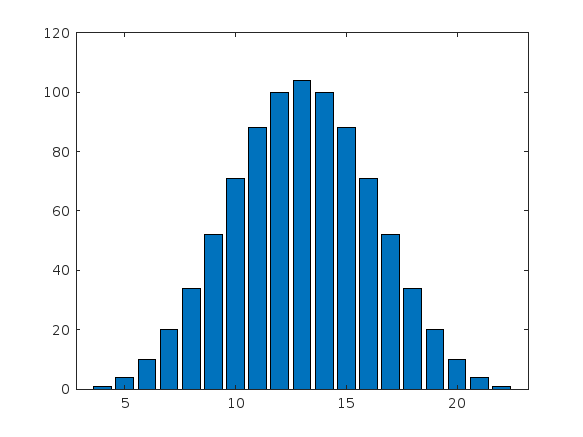
I got thoroughly nerd-sniped by this xkcd, leading me to wonder if you can use MATLAB to figure out the dice roll for any given (rational) probability. Well, obviously you can. The question is how. Answer: lots of permutation calculations and convolutions.
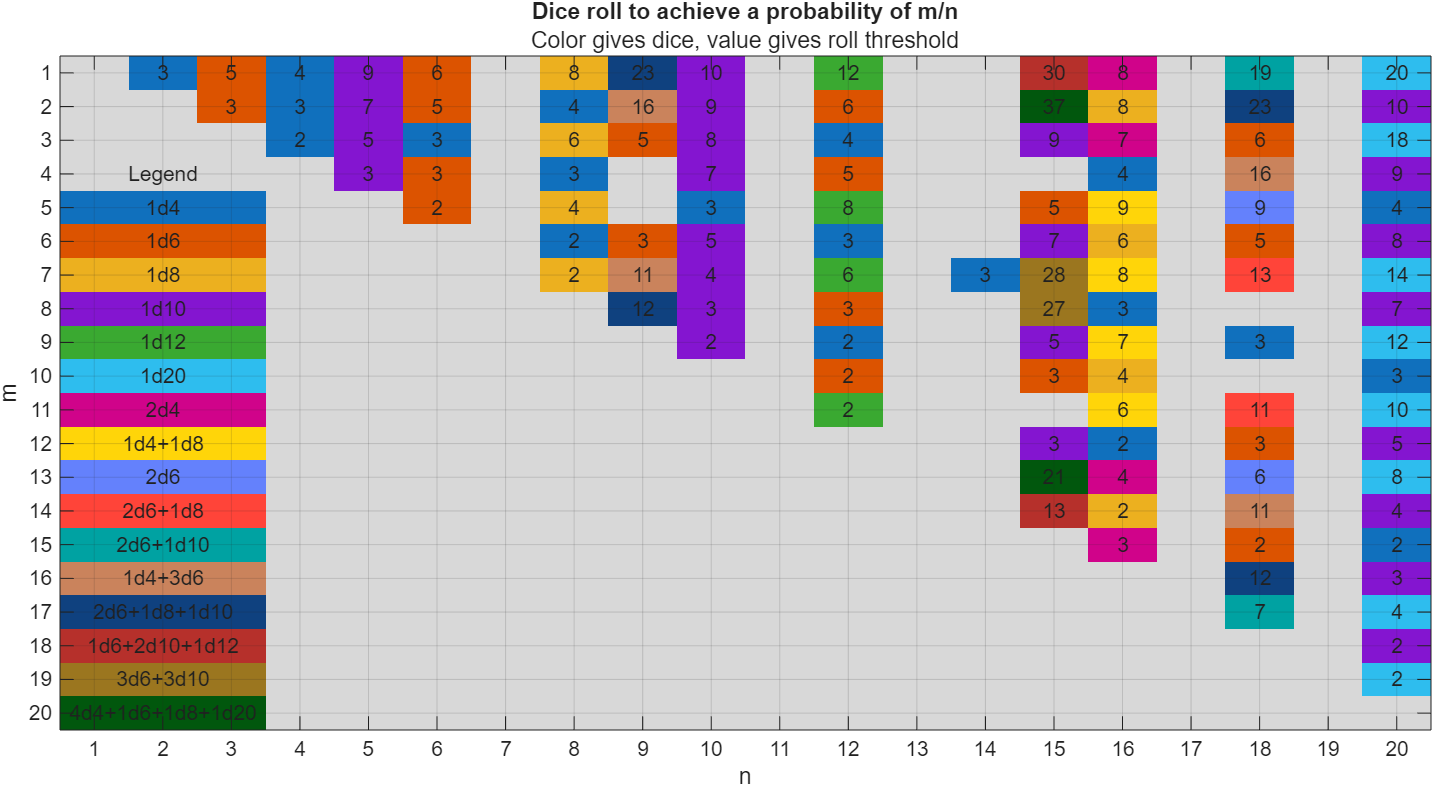
In the original xkcd, the situation described by the player has a probability of 2/9. Looking up the plot, row 2 column 9, shows that you need 16 or greater on (from the legend) 1d4+3d6, just as claimed.
If you missed the bit about convolutions, this is a super-neat trick
[v,c] = dicedist([4 6 6 6]);
bar(v,c)
% Probability distribution of dice given by d
function [vals,counts] = dicedist(d)
% d is a vector of number of sides
n = numel(d); % number of dice
% Use convolution to count the number of ways to get each roll value
counts = 1;
for k = 1:n
counts = conv(counts,ones(1,d(k)));
end
% Possible values range from n to sum(d)
maxtot = sum(d);
vals = n:maxtot;
end
You've probably heard about the DeepSeek AI models by now. Did you know you can run them on your own machine (assuming its powerful enough) and interact with them on MATLAB?
In my latest blog post, I install and run one of the smaller models and start playing with it using MATLAB.
Larger models wouldn't be any different to use assuming you have a big enough machine...and for the largest models you'll need a HUGE machine!
Even tiny models, like the 1.5 billion parameter one I demonstrate in the blog post, can be used to demonstrate and teach things about LLM-based technologies.
Have a play. Let me know what you think.