This topic has been permanently closed and transferred to MATLAB Answers.
Quiver plot with equal arrow lengths
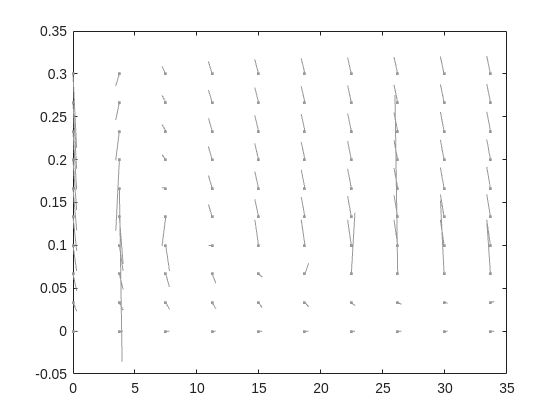
Hey,
I'm trying to create an quiver plot, with equal arrow length but unequal axis lengths. Unfortunatly, the arrows do not want to scale down to the same, length...
Can someone help?
%% system paramters
eta = .1;
mu = .1;
nu = 1;
gamma = 2;
%% steady state
s_0 = (eta.^gamma + nu.^gamma)./((1-eta)*eta.^(gamma-1));
p_0 = eta./nu;
%% dependent variables
roi = 2;
s = linspace(max([(1-roi)*s_0,0]),(1+roi)*s_0,10);
p = linspace(max([(1-roi)*p_0,0]),(1+roi)*p_0,10);
[s,p] = meshgrid(s,p);
%% gradient flow
v = s.*p.^gamma ./ (1+(1+s).*p.^gamma);
ds = -v + eta;
dp = mu*(v - nu*p);
mag = sqrt(ds.^2 + dp.^2);
arrow_scale = 3E-1;
norm_ds = arrow_scale*ds./mag;
norm_dp = arrow_scale*dp./mag;
%% plot
q = quiver(s,p,norm_ds,norm_dp,'Autoscale','off', 'Color',.6*[1,1,1]);
q.ShowArrowHead = 'off';
q.Marker = '.';