Decode LIN Data from BLF Files
This example shows you how to import and decode LIN data from BLF files in MATLAB® for analysis. The BLF file used in this example was generated from Vector CANoe™. This example also uses the LIN Description file (LDF), ExteriorLight_LIN_CH4.ldf, to decode LIN network information.
Open the LDF File
Open the database file describing the source LIN network using the linDatabase function.
ldb = linDatabase("ExteriorLight_LIN_CH4.ldf")ldb =
Database with properties:
File Information
Name: "ExteriorLight_LIN_CH4.ldf"
Path: "/tmp/Bdoc26a_3233028_2243768/tp6061b4c6/vnt-ex26110327/ExteriorLight_LIN_CH4.ldf"
ProtocolVersion: 2.2000
LanguageVersion: 2.2000
BusSpeed: 19.2000
Network Information
Nodes: [6×3 table]
Frames: [7×5 table]
Signals: [19×5 table]
Investigate the BLF File
Retrieve and view information about the BLF file. The blfinfo function parses general information about the format and contents of the Vector Binary Logging Format BLF file and returns the information as a structure. The channel details are organized primarily by protocol, with CAN and CAN FD grouped together, followed by the LIN protocol, and then sorted by ChannelID. In this example, there are 7 channels displayed for CAN/CAN FD, as the highest detected channel is 7; any channels lacking data will show 0 objects. Additionally, there are 6 LIN channels listed, as the highest channel with LIN data detected is 6.
info = blfinfo("Logging.blf")info = struct with fields:
Name: "Logging.blf"
Path: "/tmp/Bdoc26a_3233028_2243768/tp6061b4c6/vnt-ex26110327/Logging.blf"
Application: "CANoe"
ApplicationVersion: "18.2.65"
Objects: 3568
StartTime: 16-Jan-2025 14:44:41.936
EndTime: 16-Jan-2025 14:44:59.137
ChannelList: [13×3 table]
info.ChannelList
ans=13×3 table
    ChannelID    Protocol    Objects
    _________    ________    _______

        1        "CAN FD"      314
        2        "CAN"           0
        3        "CAN"         258
        4        "CAN FD"      314
        5        "CAN"           0
        6        "CAN"           0
        7        "CAN"          86
        1        "LIN"           0
        2        "LIN"           0
        3        "LIN"        1281
        4        "LIN"         939
        5        "LIN"           0
        6        "LIN"         285
Read Data from BLF File
The LIN data of interest was stored in channel 4 of the BLF file. According to the output from the blfinfo function, channel 4 for the LIN protocol contains 939 LIN messages. Read the LIN data using the blfread function. To access LIN data specify "ProtocolMode" NV pair value as "LIN". Additionally, provide LIN database object to the function call which will enable message name lookup and signal value decoding.
blfData = blfread("Logging.blf", ChannelID = 4, ProtocolMode ="LIN", Database = ldb)
blfData=939×8 timetable
       Time        ID       Name                                Data                            Length      Signals       ErrorType    ChecksumType    Checksum
    ___________    __    ___________    ____________________________________________________    ______    ____________    _________    ____________    ________

    0.10573 sec    21    DLFLeft_01     255      0    255    206    255    255      0      0      6       {1×1 struct}      None         Enhanced        219
    0.1125 sec     22    DLFRight_01    254      0    255    255    255    255    161    255      8       {1×1 struct}      None         Enhanced        136
    0.11875 sec    25    GWE_01         224      0    255    247    255    255    203      0      7       {1×1 struct}      None         Enhanced        193
    0.12187 sec    26    GWE_02         244      0      0      0      0      0      0      0      1       {1×1 struct}      None         Enhanced        240
    0.20625 sec    23    DLRLeft_01       0    254     34    255    255    255    255      0      7       {1×1 struct}      None         Enhanced         71
    0.21146 sec    24    DLRRight_01     16    254     55    255    255      0      0      0      5       {1×1 struct}      None         Enhanced        224
    0.21562 sec    27    WWS_01         253      4    170      0      0      0      0      0      3       {1×1 struct}      None         Enhanced        247
    0.22135 sec    21    DLFLeft_01     255      0    255    235    255    255      0      0      6       {1×1 struct}      None         Enhanced        190
    0.22812 sec    22    DLFRight_01    253      0    255    255    255    255     52    255      8       {1×1 struct}      None         Enhanced        246
    0.23437 sec    25    GWE_01         224      0    255    247    255    255    122      0      7       {1×1 struct}      None         Enhanced         19
    0.2375 sec     26    GWE_02         236      0      0      0      0      0      0      0      1       {1×1 struct}      None         Enhanced        248
    0.30573 sec    21    DLFLeft_01     252      0    255     36    255    255      0      0      6       {1×1 struct}      None         Enhanced        137
    0.3125 sec     22    DLFRight_01    253      0    255    255    255    255    116    255      8       {1×1 struct}      None         Enhanced        182
    0.31875 sec    25    GWE_01         224      0    255    247    255    255    108      0      7       {1×1 struct}      None         Enhanced         33
    0.32187 sec    26    GWE_02         236      0      0      0      0      0      0      0      1       {1×1 struct}      None         Enhanced        248
    0.40625 sec    23    DLRLeft_01       0    254    128    255    255    255    255      0      7       {1×1 struct}      None         Enhanced        232
      ⋮
View signals from the first "GWE_01" message.
blfData.Signals{3}ans = struct with fields:
GWE_TurnIndicationLeft: 0
GWE_TurnIndicationRight: 0
GWE_WarningLight: 0
GWE_DrivingLight: 1
GWE_Reserved: 203
Repackage and Visualize Signal Values of Interest
To organize signal data from each unique message on the bus into a signal timetable, use the hLINSignalTimetable helper function. This example demonstrates how to create signal timetables for the specific message of interest, "GWE_01," from the LIN message timetable. The "GWE_01" message includes the following signals: left turn, right turn, warning/hazard light, and driving light.
signalTimetable = hLINSignalTimetable(blfData,'GWE_01')signalTimetable=171×5 timetable
Time GWE_TurnIndicationLeft GWE_TurnIndicationRight GWE_WarningLight GWE_DrivingLight GWE_Reserved
___________ ______________________ _______________________ ________________ ________________ ____________
0.11875 sec 0 0 0 1 203
0.23437 sec 0 0 0 1 122
0.31875 sec 0 0 0 1 108
0.43437 sec 0 0 0 1 248
0.51875 sec 0 0 0 1 199
0.63437 sec 0 0 0 1 197
0.71875 sec 0 0 0 1 245
0.83437 sec 0 0 0 1 119
0.91875 sec 0 0 0 1 67
1.0344 sec 0 0 0 1 198
1.1187 sec 0 0 0 1 86
1.2344 sec 0 0 0 1 14
1.3187 sec 0 0 0 1 134
1.4344 sec 0 0 0 1 233
1.5187 sec 0 0 0 1 153
1.6344 sec 0 0 0 1 26
⋮
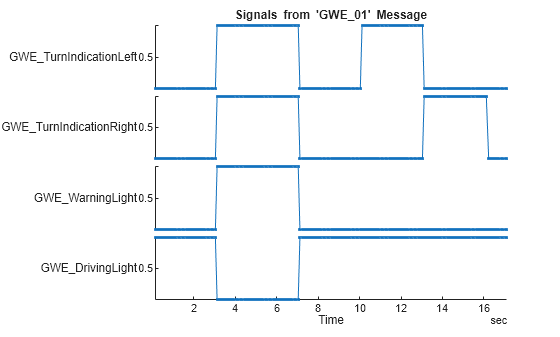
To visualize the signals of interest, columns from the signal timetables can be plotted over time for further analysis.
stackedplot(signalTimetable,{"GWE_TurnIndicationLeft","GWE_TurnIndicationRight","GWE_WarningLight","GWE_DrivingLight"},marker=".")
title("Signals from 'GWE\_01' Message")