Design Switching Controllers by Using Simulink Functions
This example shows how to use a Stateflow® chart to model decision logic that switches between a P-only controller and a PID controller.

The Stateflow chart SwitchingController implements a controller that switches between the states STEADY, P, and PID depending on the value of the input data e, which represents the error in the controller. The chart outputs the control value u and the Boolean value PID, which indicates whether the PID state is active.
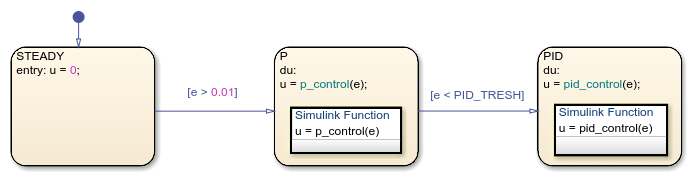
Initially, the STEADY state is active and the chart produces a control output u of 0. The chart switches from STEADY to P when e is greater than 0.01. The chart switches from P to PID when e is lower than the parameter PID_TRESH, defined in the model workspace.
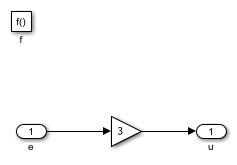
In the P state, the Simulink® function p_control implements a proportional control strategy with a gain of 3. When this state is active, the steady state gain of the closed-loop system is 3/4 = 0.75, which results in an error of 0.25.
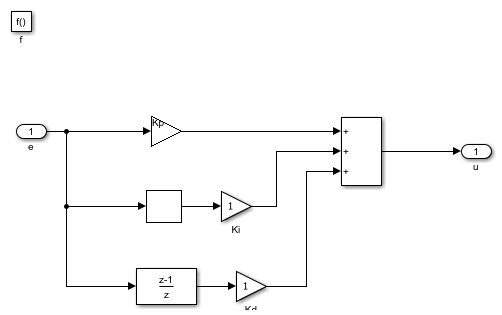
In the PID state, the Simulink function pid_control implements a PID control strategy. To ensure a smooth transition in the control effort, this function has the same proportional gain as p_control.
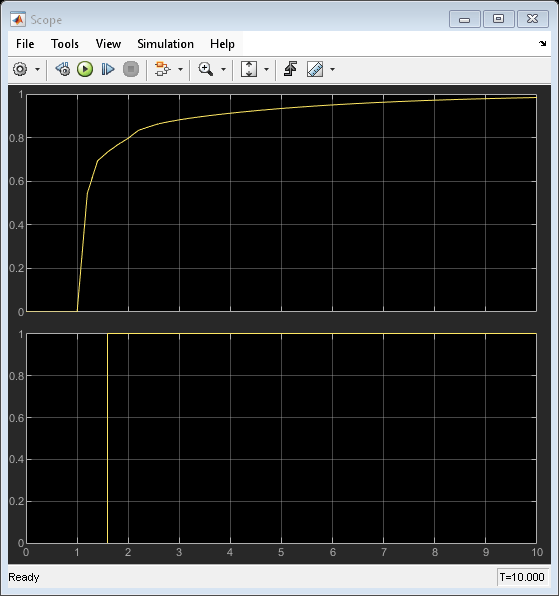
Initially, the value of the parameter PID_THRESH is 0.3. When you simulate the model, the error crosses this threshold at time  . Then, the chart switches to the PID controller and the steady state error approaches zero.
If you change the value of the parameter PID_TRESH to 0.1, the error is never below this threshold. The chart remains in the P state indefinitely and the error stabilizes at 0.25.
