Use Stateflow Chart for Test Harness Inputs and Scheduling
Use a Stateflow Chart for Test Harness Scheduling
You can define test harness scheduling using a Test Sequence block, a MATLAB® Function block, or a Stateflow® chart. If you use a Stateflow chart as a scheduler, you can use Stateflow features that are not available with either the Test Sequence block or MATLAB Function block. You can define more complicated scheduling by using Stateflow variants, graphical functions, super transitions, and super steps. For example, with Stateflow variants, you can specify multiple test scenarios in a single test harness. If you do not need to test multiple test scenarios or use complicated sequence logic, use the Test Sequence block, which has simpler syntax for test scheduling.
Note
You must have a Stateflow license to use a chart for test harness inputs or scheduling.
To use a Stateflow chart as a test harness test scheduler, the model or subsystem under test must have at least one function call signal.
When setting up a test harness from a model, the steps for using a chart as the scheduler are:
In a model or subsystem, right-click to display the context menu. To add the Simulink Test app options to the menu, point to Select Apps and click the Simulink Test button
 . Then, in the Simulink Test app section,
click the Add Test Harness button
. Then, in the Simulink Test app section,
click the Add Test Harness button  .
.For a model, in the Create a Test Harness dialog box, set Add scheduler for function-calls and rates to
Chart.For a subsystem, in the Create a Test Harness dialog box, set Generate function-call signals using to
Chart.
A chart named Simulink Function scheduler is added to the test harness.

Open the Stateflow chart and define the test sequence using Stateflow states, transitions and other objects. The Stateflow states serve the same purpose as the sequence steps in a Test Sequence block. The transitions define the criteria for moving from one state to another.
To programmatically specify a Stateflow chart as a scheduler, set the SchedulerBlock property
of sltest.harness.create to Chart.
Use a Stateflow Chart as a Test Harness Source
When creating a test harness from a model, the steps for using a chart as the test harness source are:
In a model or subsystem, right-click to display the context menu. In the Simulink Test app section
click the Add Test Harness button
.In the Create Test Harness dialog box, in the Sources and Sinks section, select
Chartinstead ofInport.A chart is added to the test harness. For example,

Open the Stateflow chart and define the test harness sources using Stateflow logic.
To programmatically specify a Stateflow chart as a source, set the Source property of
sltest.harness.create to Chart.
Stateflow Chart as Test Harness Scheduler and Source
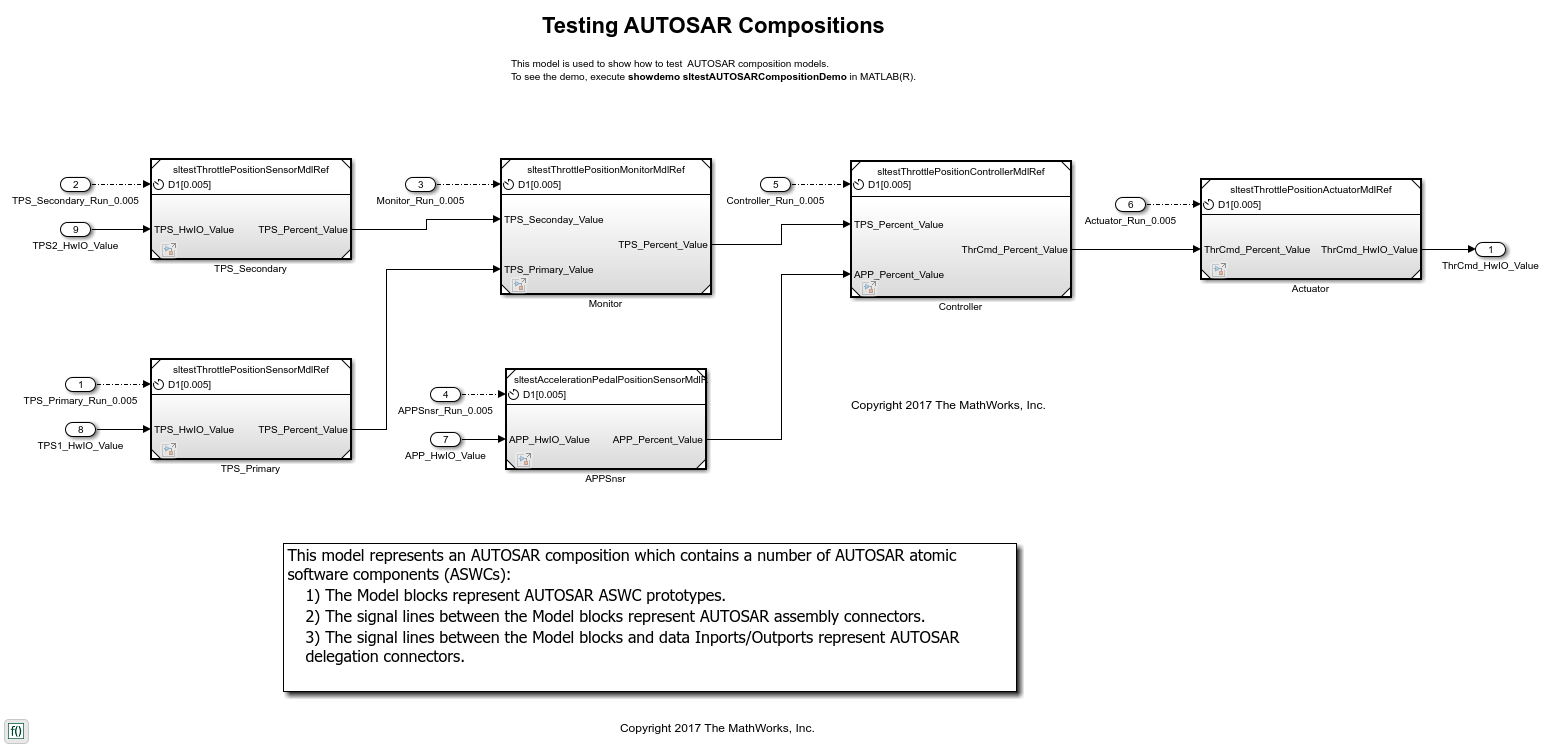
This example shows how to use a single Stateflow chart as both a test scheduler and source in a test harness. The test harness for the sltest_autosar_chart.slx model in this example has already been created.
sltest_autosar_chart is an AUTOSAR composition model of a throttle position controller for an automobile. AUTOSAR composition models contain a network of interconnected Model blocks, each of which represents an atomic AUTOSAR software component (ASWC). The Simulink® inports and outports represent AUTOSAR ports. The signal lines represent AUTOSAR component connectors.
The inputs that capture the primary and secondary throttle position are modeled using an external time series input and are directly fed through the Chart without modification. This modeling style is useful when some stimulus inputs can be modeled and others are only available as externally captured data.
Navigate to a directory with write permissions before running this example.
Open the Model
Open the Test Harness
The test harness has already been created for this example.
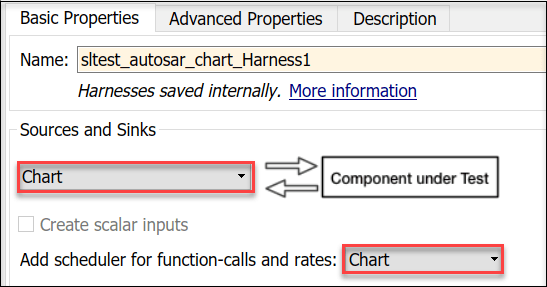
This image shows the portion of the Create Test Harness dialog box where Chart was selected as both the source and scheduler. You do not need to recreate the test harness.
To open the harness, use the perspective control in the lower-right corner of the editor canvas and click Internal Test Harness.
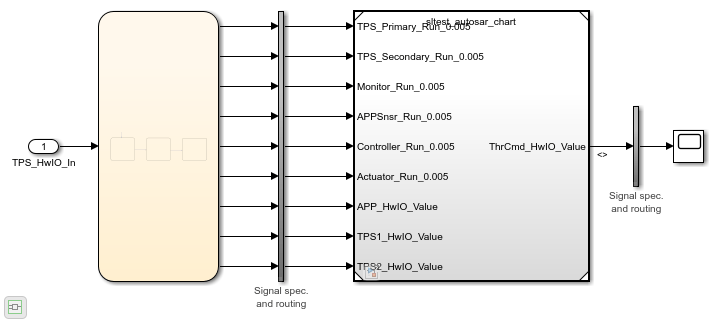
The test harness opens.
Open the Stateflow Chart
Double-click the chart in the test harness to view the scheduling logic.
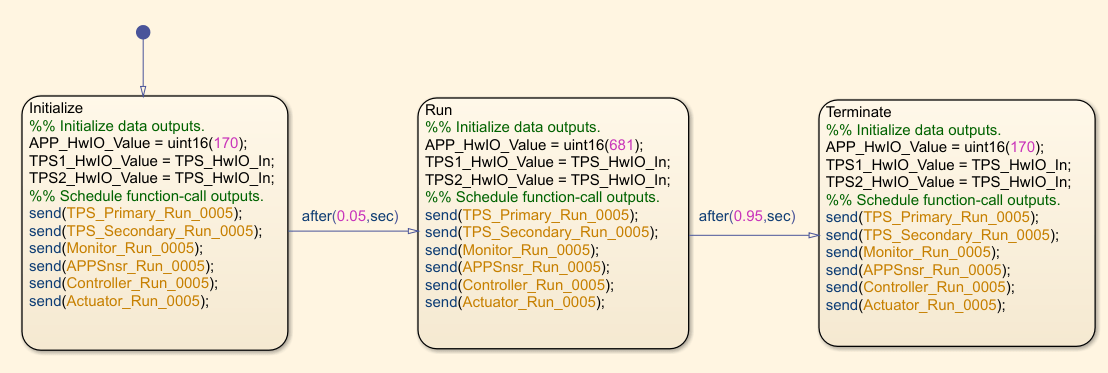
The component under test (the AUTOSAR model) requires the accelerator pedal position sensor input APP_HwIO_Value, which is modeled in the chart by three states.
The Initialize state sets the input to a nominal value (170) and the Run state models a steady acceleration command for 950 ms. The acceleration command is reset to the nominal value in the Terminate state.
The component under test uses the export-function modeling style. (See Export-Function Models Overview.) When the test harness was created, its Stateflow chart was configured to call each root-level Simulink Function block and send a trigger event to each function-call subsystem in the model. In this example, the code to send the trigger events is in each state after the stimulus waveforms have been generated.
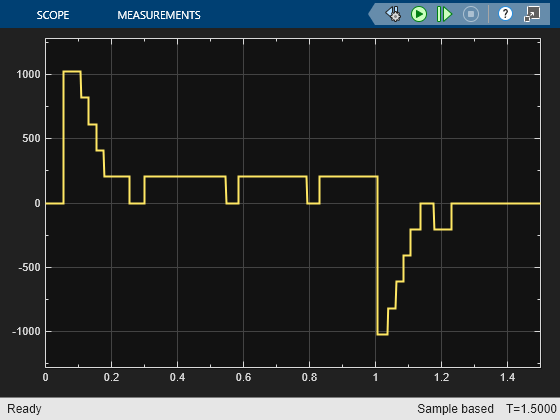
Run the Model
Run the model from the test harness. To see the throttle command output, open the Scope in the test harness.
See Also
sltest.harness.create | Test Sequence | Function
Caller