Online Frequency Response Estimation Using PRBS Input Signals
This example shows how to use the pseudorandom binary sequence (PRBS) option in the Frequency Response Estimator block to perform online frequency response estimation of a Simulink® model. You can either obtain the frequency response estimation result during simulation or store the data for later offline estimation. The PRBS option brings unique benefits compared to the sinestream and superposition modes, such as faster estimation.
Control System Model
This example uses a model that already contains a Frequency Response Estimator block configured for estimation using PRBS input signal.
Open the model.
mdl = "OnlineFreqRespEstimExPRBSAutogen";
open_system(mdl)
The model contains a plant in the closed-loop configuration with a PI controller. The Frequency Response Estimator block accepts the control signal as the input u. It feeds the control signal plus a perturbation into the plant input. You specify properties of the perturbation signal using the block parameters.
Experiment Parameters
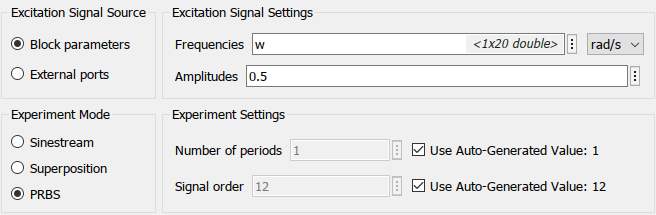
The Frequency Response Estimator block is configured to run the experiment in PRBS mode. The block is configured to use an amplitude of 0.5, and estimates the frequency responses at the frequencies w = logspace(0,2,20). For this example, the experiment sample time is 0.005 seconds, which is fast enough for the wmax of 100 rad/s.
Set the parameters of PRBS input signal based to the specified frequencies. The block displays recommended values for the signal parameter in the Experiment Length section of the block dialog box. For this example, Number of periods should not be larger than 1 and the Signal order should not be less than 12.
Alternatively, you can use the autogenerated PRBS parameters for frequency response estimation experiments. In online estimation mode, the block determines these parameters from the frequency vector entered in the block parameter Frequencies. You can check either one or both checkboxes to apply the autogenerated parameters for Number of periods and Signal order. Here, the auto-generated number of periods is 1 and signal order is 12.
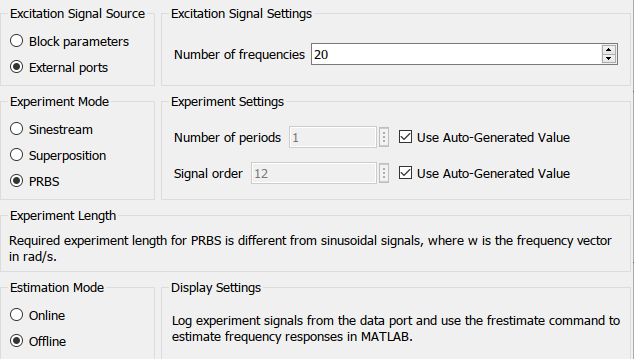
For online estimation, the block does not support using autogenerated values when using external ports as excitation signal source. If you set the parameter to External ports, the two checkboxes are not available.

Start/Stop Signal
The step blocks connected to the start/stop input port turn the experiment on with a rising signal at 5 s, when the model is at steady state. The block provides a recommended experiment length of about 20.5 s. To ensure that the experiment runs to completion, the start/stop signal stops the experiment at 26s.
Estimation Results
Simulate the model. The Display Bode Plot block parameter is enabled, so the block automatically generates a plot of the specified baseline model and updates it periodically with the estimated frequency response.
sim(mdl)

Additionally, you can use the scopes to visualize the control signal, the perturbation signal, and the plant output.
The signal at the frd port is a vector containing the current values of the estimated response at each frequency in w. The To Workspace block connected to that port writes the signal to a MATLAB® workspace variable frdata. In the To Workspace block, the Limit data points to last parameter is set to 1, so that frdata contains only the final estimated responses at each frequency.
Convert frdata to a frd model object.
sys_estim = frd(frdata,w);
size(sys_estim)
FRD model with 1 outputs, 1 inputs, and 20 frequency points.
Close the model.
close_system(mdl,0)
Collect Experiment Data for Offline Estimation
You can also configure the Frequency Response Estimator block to collect experiment data for offline estimation.
Open the model.
mdl = "CollectFreqRespEstimDataExPRBSAutogen";
open_system(mdl)
Experiment parameters in this model are identical to the one for online estimation. Similar to the online estimation workflow, you can also use autogenerated values for the PRBS input signal parameters. Based on the same frequency vector, the autogenerated number of periods is 1 and signal order is 12.

For offline estimation, the block supports using autogenerated values when using external ports as excitation signal source. In this situation, the block determines the PRBS input signal parameters during runtime, based on the frequency vector entered through the external port.
The model is configured to log the estimation data at the block output port data. The data is stored in the MATLAB workspace as the Simulink.SimulationData.Dataset object logsout. Because data is the only logged port, you can access the logged data in the first entry in logsout. The Values field of that entry is a structure containing seven fields.
logdata = logsout{1}.Valueslogdata = struct with fields:
Ready: [1×1 timeseries]
Perturbation: [1×1 timeseries]
PlantInput: [1×1 timeseries]
PlantOutput: [1×1 timeseries]
Info: [1×1 struct]
u: [1×1 timeseries]
y: [1×1 timeseries]
The Ready field is a timeseries containing a logical signal that indicates the time steps that contain the data used for the estimation. Perturbation contains the perturbation applied to the plant. The PlantInput and PlantOutput timeseries contain the signals at the block inputs u and y, respectively. The Info field stores the number of periods of the PRBS input signal.
Estimate Frequency Response
If you collect this data in a deployed environment with limited computational resources, you can use the data to perform frequency response estimation offline using the frestimate command. Use the logdata structure with frestimate and the same frequencies you used for the Frequencies parameter in the block. frestimate processes logdata to obtain a frequency response data (frd) model containing the estimated responses at those frequencies.
sys_estim = frestimate(logdata,w,'rad/s');
size(sys_estim)
FRD model with 1 outputs, 1 inputs, and 20 frequency points.
Examine the estimated frequency response.
figure
bode(sys_estim,'b*') 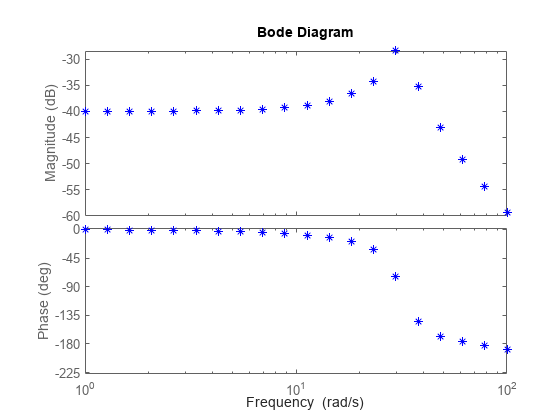
Close the model.
close_system(mdl,0)