View Model Testing Status in Simulink Test Manager
With Simulink® Check™ and Simulink Test™, you can monitor the progress and quality of your model testing efforts directly from the Dashboard tab in Simulink Test Manager. The dashboard analyzes the models, tests, and test results in your project to determine the current state of your model testing activities. From the dashboard, you can access detailed metric results, including the status of testing and aggregated coverage for each model in your project. The metrics in the dashboard measure different aspects of model testing completeness and quality based on industry-recognized standards such as ISO 26262 and DO-178.
Collect and Inspect Metric Results
Load a project that contains your model testing artifacts. The dashboard uses the project information and structure to identify and analyze the artifacts that are relevant to your design. The project folder determines which artifacts the dashboard metrics analyze.
If you do not have a project, you can create a project directly from your current model or folder. For information, see Create Project. You can, optionally, modify your project settings to reconfigure what you see in the dashboard. For general information on how to customize and use projects, see Create Project to Use Model Design and Model Testing Dashboards.
Open Simulink Test Manager. For information, see Simulink Test Manager (Simulink Test).
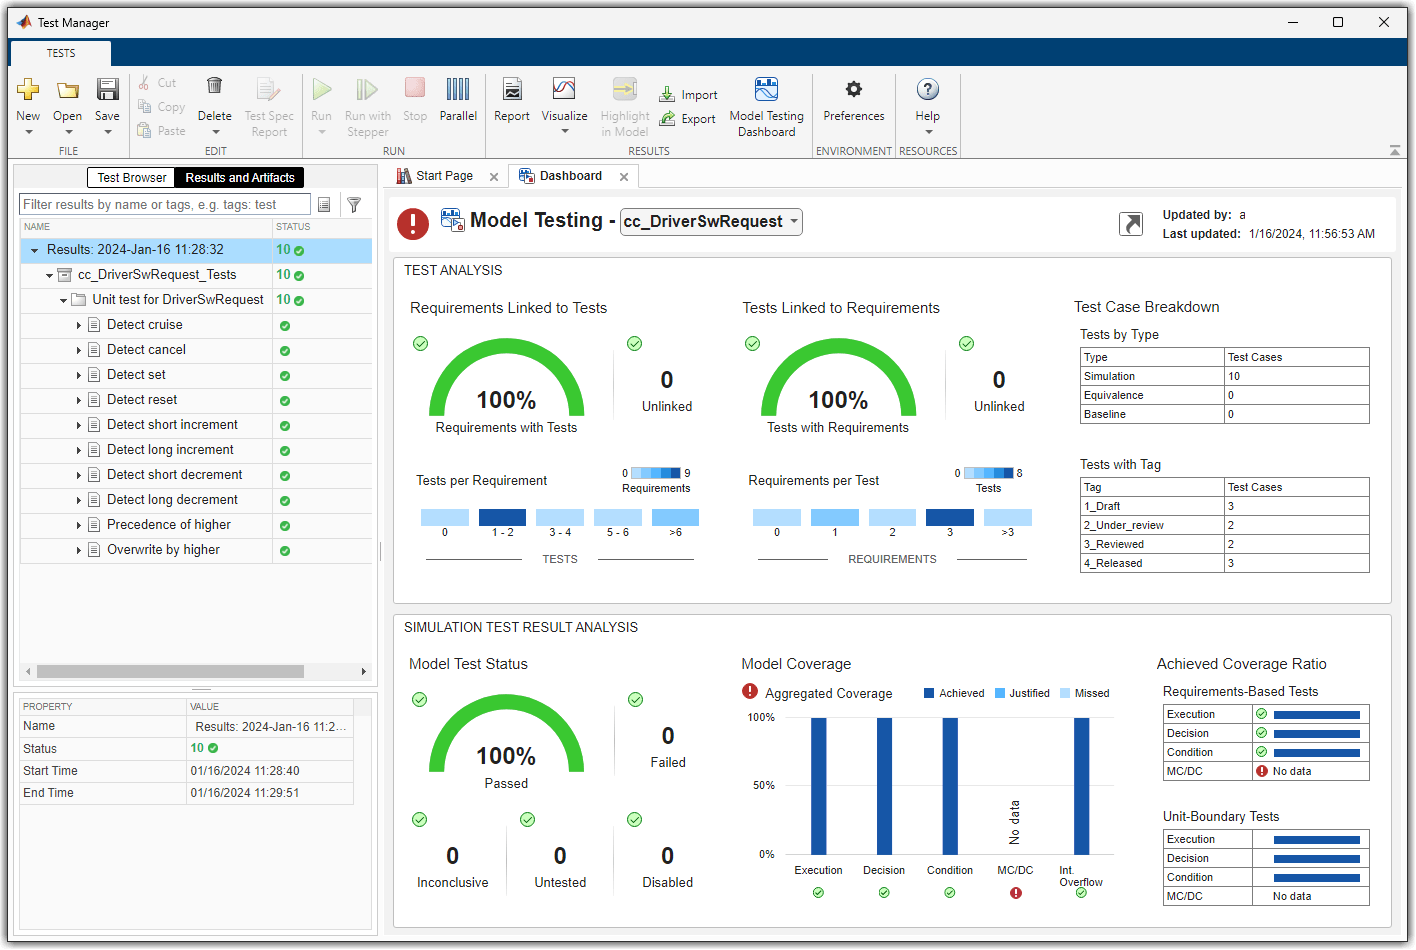
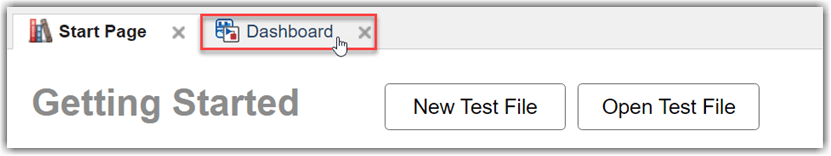
Open the dashboard. In Simulink Test Manager, click the Dashboard tab. By default, the Dashboard tab appears next to the Start Page tab in Simulink Test Manager. If you prefer not to have the Dashboard tab open automatically at startup, you can clear Open dashboard at startup in the Test Manager preferences.
The first time that you open the dashboard on your project, the dashboard needs to perform an initial analysis of your project. The initial analysis allows the dashboard to identify each of the artifacts in the project, its inner structure, and the traceability relationships between artifacts. For information on how the dashboard monitors and analyzes artifacts, see Monitor Artifact Traceability and Detect Outdated Results with Digital Thread.
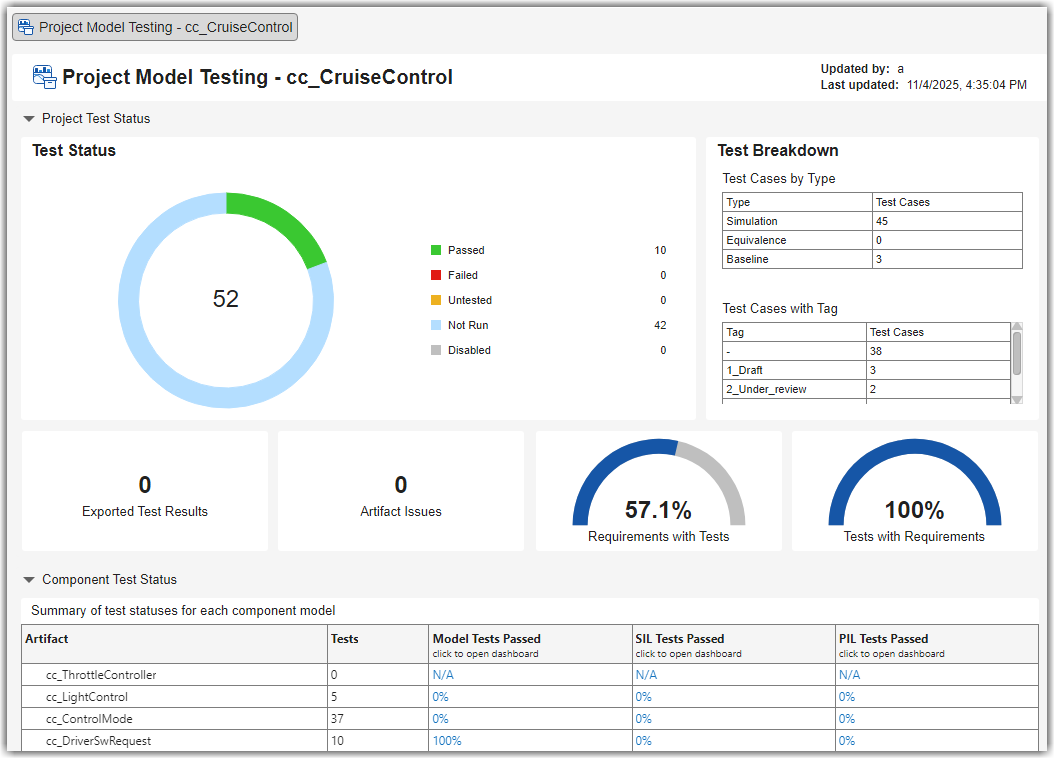
The Project Model Testing dashboard opens and shows a summary of the model testing and requirements traceability across the component models in your project.
Inspect the metric results. The dashboard widgets summarize the metric results and show testing issues that you can address, such as failed tests, disabled tests, and missing traceability between requirements and tests.
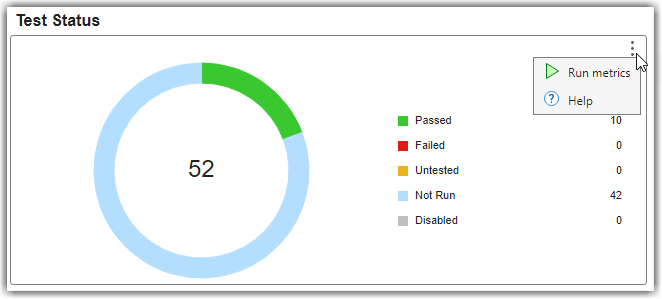
To view information about the metric results in a widget, point to the widget, point to the three dots in the top-right corner of the widget, and click Help.
To see which artifacts contribute to specific metric results, click the associated widget to view the metric details. For example, in the Test Status section, click the Passed section of the donut widget to view which specific tests and test results contribute to the test status metric results.
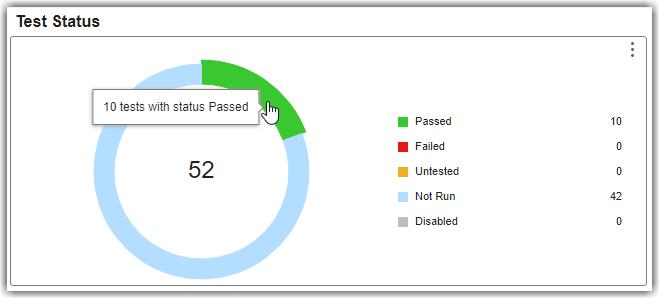
The dashboard opens the Metric Details for the widget with a table of metric values and hyperlinks to each related artifact. The table shows the model unit tests that passed and the associated test file. If you point to a hyperlink, you can see a tooltip with detailed information about the artifact. As you run tests in Simulink Test Manager, the dashboard consolidates the data from across your test results to automatically determine the overall model test status and aggregated model coverage. For more information, see Explore Status and Quality of Testing Activities Using Model Testing Dashboard.

You can view additional metric results from the Model Testing, SIL Code Testing, and PIL Code Testing dashboards by using the links in the Component Test Status table. Each row of the table provides a summary of the test status for a specific component model, including the number of tests and the percentage of tests that passed for model, SIL, and PIL testing. To open the corresponding dashboard, click the link in the Model Tests Passed, SIL Tests Passed, or PIL Tests Passed column.

If you make a change to an artifact in the project, the dashboard warns you to refresh the dashboard. On the warning banner, click Collect.

Open Dashboard App
Alternatively, you can directly open the dashboard app. In the Test Manager toolstrip, in the Results section, select Dashboard > Dashboard App.
For information about the dashboard app, see Summarize Status of Testing for Project.
See Also
Model Testing Dashboard | Simulink Test Manager (Simulink Test)