Summarize Status of Testing for Project
When you design complex systems, like a cruise control system, your team manages testing and requirements traceability to make sure that your models implement your requirements and your requirements test your implementation. To help your team manage and assess the status of these objectives across your project, you can use the Project Model Testing dashboard.
The Project Model Testing dashboard provides a summary of test statuses and requirements traceability across your project. You can use the metric results to identify gaps such as missing traceability links and insufficient testing. The dashboard allows you to navigate directly to the affected artifacts, opening them in the appropriate development tools for further refinement. Additionally, you can use the links in the Project Model Testing dashboard to open the related Model Testing, SIL Code Testing, and PIL Code Testing dashboards.
When you make a change to an artifact, the dashboard can automatically detect the change and identify outdated metric results. You can incrementally re-collect these metrics to help make sure that your team has up-to-date information on project artifacts and visibility into the overall status of your project, helping your team maintain high-quality testing standards and supporting compliance with industry specifications and guidelines.
Open Project and Dashboard
As you design your system, you manage many different types of artifacts, including requirements, models, tests, and results. To organize those artifacts and define the scope of artifacts that the dashboard metrics analyze, you need to have your artifacts inside a project. For this example, you use the dashboard example project for a cruise control system. For more information, see Create Project to Use Model Design and Model Testing Dashboards.
1. Open a project for an example cruise control system that simulates controlling the speed of a vehicle automatically. The project contains units that model specific behaviors inside the cruise control system and a component that integrates those lower level units together. The cruise control system manages the vehicle speed based on specific conditions specified in the requirements. The project includes requirement specifications for the system and tests for the cruise control response to driver inputs and system behavior.
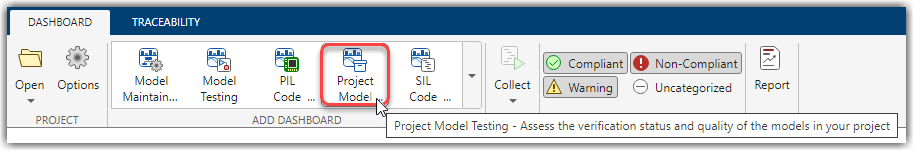
openProject("cc_CruiseControl");2. Open the Project Model Testing dashboard by clicking the Project tab and clicking Model Testing Dashboard.
When you open a dashboard, the dashboard analyzes the artifacts inside the project folder, identifies potential software units and components, and traces requirements-based testing artifacts to their associated units and components.
If you already have the Dashboard app open, you can open the Project Model Testing dashboard from the Dashboard tab by clicking Project Model Testing in the dashboard gallery in the toolstrip.
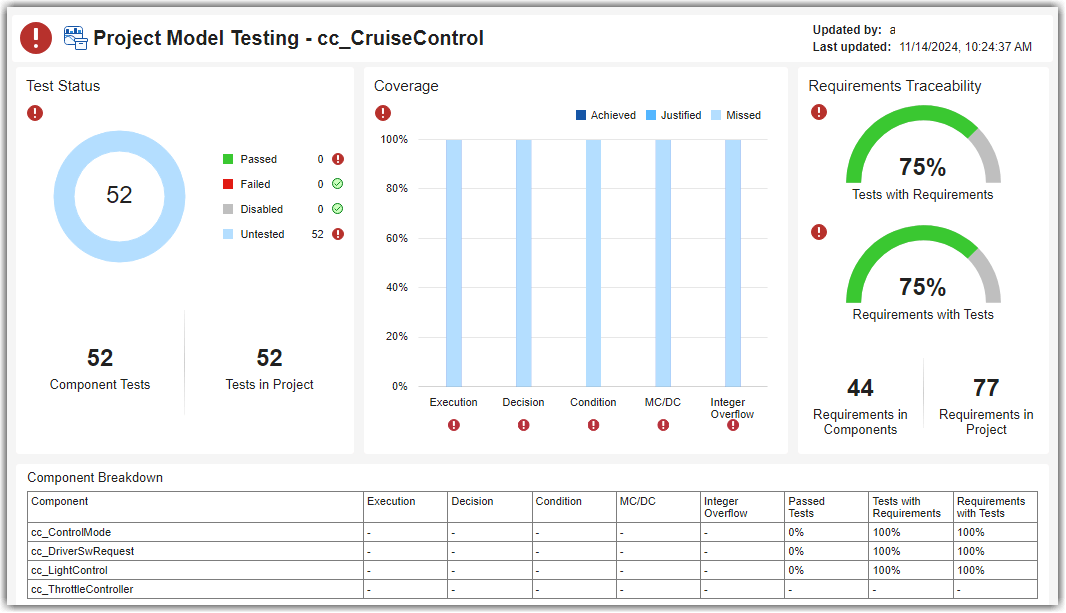
The dashboard collects project model testing metric results for the units in the project. For example, in the example cruise control project, the dashboard collects metric results for the units cc_ControlMode, cc_DriverSwRequest, cc_LightControl, and cc_ThrottleController. Collecting data for a metric requires a license for the product that supports the underlying artifacts, such as Requirements Toolbox™ or Simulink® Test™. After you collect metric results, you need only a Simulink Check™ license to view the results.
View Overall Status of Testing
The Project Model Testing dashboard can help you see the current status of model, SIL code, and PIL code testing in your project, identify gaps in testing and requirements traceability, and navigate directly to artifacts that need development.
View Testing Status
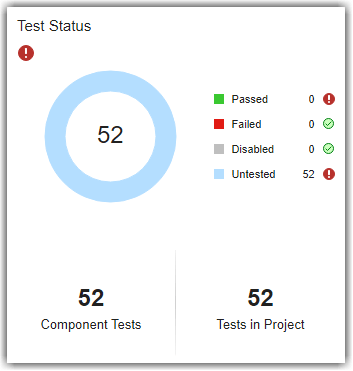
To view an overview of the testing status for units in your project, you can use the Test Status widget.
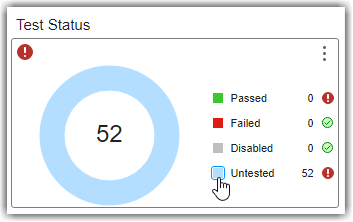
The Test Status widget displays a donut chart summarizing the number of unique tests in your project, categorized by their status:
Passed – The test ran and returned a pass result.
Failed – The test ran, but returned a fail result.
Untested – The test ran, but no verification was performed. This occurs if no
verifystatements or other criteria were specified, or if the criteria were specified but not executed.Not Run – The test has not run.
Disabled – The test is intentionally excluded from execution and will not run.
When you run a test that includes verify statements or other criteria and the statements and criteria do not return a pass or fail result, the overall test returns an untested result. The dashboard analyzes the tests in your project to determine which tests directly contribute to the quality of component testing and which tests are for overall project testing. If you see many tests that have not run, make sure to review which tests the dashboard is classifying as component tests. Component tests evaluate the component design, or a part of the design, in the same execution context of the component. These tests help assess the quality of the component.
You can directly navigate to the tests that meet these criteria by clicking the widgets in the dashboard. To find out which artifacts contribute to a metric and how the metric calculates the metric results, you can point to a widget and use the Help to view the documentation for the associated metric for the widget.
Currently, in the example project, the tests have not run yet.
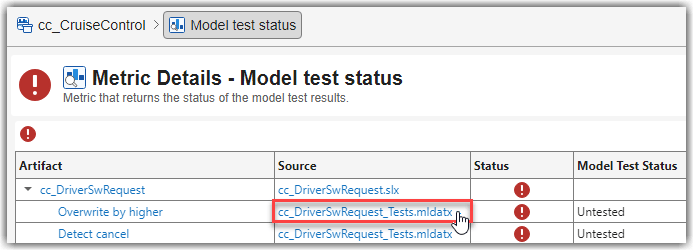
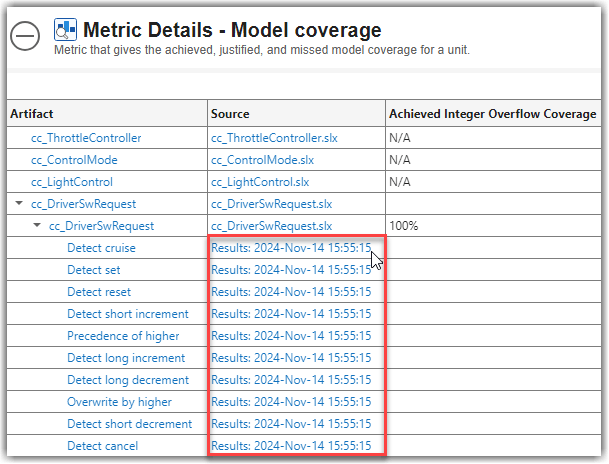
1. View more information about the tests that have not run by clicking the blue square next to Not Run. The dashboard opens a Metric Details table with hyperlinks to the tests and the source test file. In Metric Details, you can click the hyperlinks to open the test or test file directly in Test Manager.
2. Open and run the tests for the cc_DriverSwRequest model. In Metric Details, in the Source column, click the cc_DriverSwRequest_Tests.mldatx link. The test file opens in Test Manager. In the Test Browser, right-click and run cc_DriverSwRequest_Tests.
3. After the tests run, return to the Project Model Testing dashboard. The dashboard automatically detects the new test results and shows a warning banner that the metric results are no longer up to date. Click Collect to update the impacted results in the current Metric Details table. The tests for cc_DriverSwRequest no longer appear in the list of tests that have not run in Metric Details.
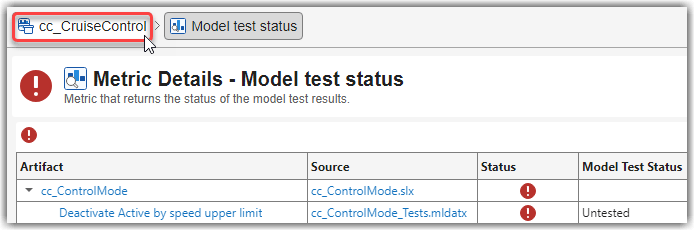
4. Use the breadcrumb trail at the top of the dashboard to navigate from the Metric Details back to the main project metric results for the cc_CruiseControl project.
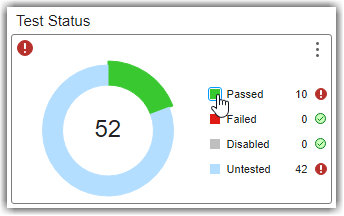
5. Update the impacted metric results for the overall Project Model Testing dashboard by clicking Collect in the warning banner. In the Test Status widget, the donut chart shows the progress that you made towards the testing goals for your project. Now, 10 tests are passing and 42 tests have not run. Typically, you execute each of the tests in the project. For this example, leave the rest of the tests as not run.
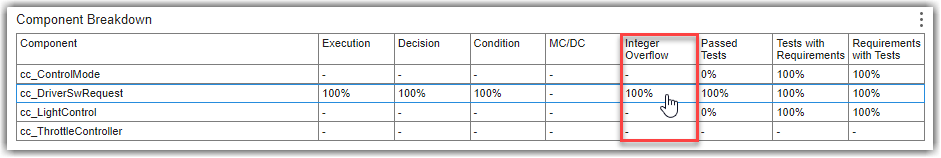
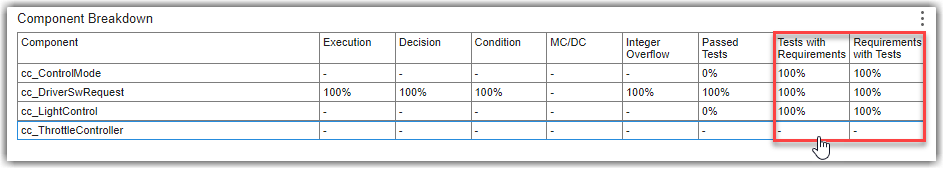
6. View the percentage of tests that passed for each unit. In the Component Test Status section at the bottom of the dashboard, see the Model Tests Passed column. Components that have tests show the percentage of tests that passed. For example, the cc_DriverSwRequest model now has 100% of tests passing. Components that do not have component tests that trace to them show N/A.
7. View the traceability between the cc_DriverSwRequest model, tests, and results. In the toolstrip, click the Traceability tab, and, in the trace views gallery, click the Tests and Results trace view. In the Project panel, click cc_DriverSwRequest to view the test and result artifacts that trace to cc_DriverSwRequest.
In this example cruise control system, the driver of the vehicle can control the cruise control by using five buttons. These buttons control the activation, cancellation, and vehicle speed settings for the cruise control system. The driver switch request system makes sure that if a driver uses these buttons to request changes to the cruise control mode, the system sends the requests only one time and allows higher priority commands, like canceling the cruise control, to override lower priority requests. The cc_DriverSwRequest model has tests that verify the functionality of driver requests to help make sure that the cruise control system handles driver inputs as expected according to the requirements. For example, there are driver switch request tests that evaluate the functionality implemented for requirements such as making sure the system detects short and long button presses and handling different priority requests from the driver. By running these tests, model developers and test engineers can verify that the model interprets and processes driver inputs as expected, providing the expected interaction between the driver and the vehicle cruise control system.
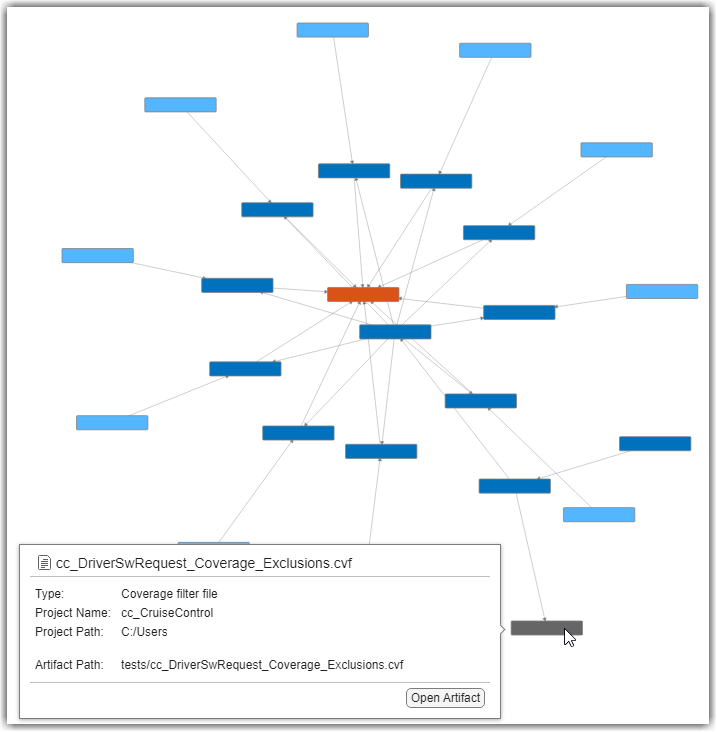
In the trace view, you can see the test file for the unit, the test suite, the test cases, and the connection between those tests and their individual test results. The trace view also includes relationships to additional artifacts such as coverage filters that impact the test coverage.
You can view more information about an artifact by pointing to the artifact in the trace view work area. You can also automatically rearrange artifacts by using the Layout menu in the toolbar. The Cluster layout option is helpful for visualizing large projects with complex hierarchies.
8. Above the trace view work area, click the Project Model Testing - cc_CruiseControl tab to return to the Project Model Testing dashboard.
Explore Test Cases and Results
To understand the types of test cases in your project or to find test cases that use specific tags, you can use the Test Breakdown widget. The widget categorizes your test cases by type and tag to help you identify the testing approach of the project and test cases that require review. The individual widget for:
Test Cases by Type shows how many simulation, equivalence, and baseline test cases are in the project. To see which specific test cases are in each category, you can click on that row of the table.
Test Cases with Tag categorizes the test cases by each unique tag. You can view which specific test cases are in each category by clicking on the row with that tag name. You can add tags to test cases by using the Test Manager app. This widget helps you organize, filter, and track test cases by their development status or other workflow that you define.
If you need to keep track of which test results you have exported, you can use the Exported Test Results widget. After you run test cases and generate test results, you can export those test results into a separate file (MLDATX). The Exported Test Results widget counts the number of exported test result files in the project. You can use this widget to track which test results you have exported.
Identify Artifact Issues Impacting Traceability
To identify and resolve potential problems that can impact the metric results, review the Artifact Issues widget. The widget highlights the number of issues related to your project artifacts, such as model callback errors. Addressing these issues can help you properly reflect the up-to-date status and progress of your artifacts and metric results in the dashboard. When you open the dashboard, the digital thread analyzes the project and collects information about the project artifacts, the artifact structure, and the traceability relationships between artifacts such as tests and requirements. If an artifact generates a warning or error during artifact analysis, the dashboard considers that an artifact issue. Artifact issues in a project can lead to incorrect metric results.
You can investigate artifact issues by clicking the Artifact Issues widget. The Artifact Issues tab shows the artifact issue message, source, and severity. If you have warnings or errors, the Artifact Issues tab displays detailed information for each issue. If not, you see an empty table.
Artifacts generate warnings if the dashboard does not support the specific artifact, modeling construct, or relationship. For example, the dashboard does not execute callbacks on model loading or closing. If a model relies on a callback to link to another artifact, that artifact does not link to the model when the dashboard runs the artifact traceability analysis. For example, suppose a model in your project uses callbacks. When the dashboard performs artifact analysis, the artifact returns a warning because the dashboards do not execute model loading callbacks when loading the model for analysis.
Artifacts generate errors if the dashboard was not able to properly trace artifacts, analyze artifacts, or collect metrics. For example, the dashboard cannot analyze a dirty test case until you resave the test case.
Fix artifact issues to help avoid incorrect metric results.
View Traceability Between Requirements and Tests
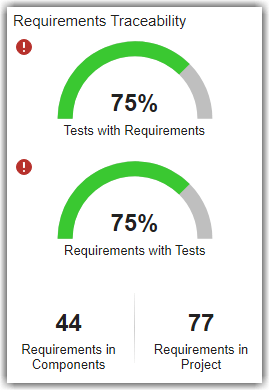
To make sure the requirements for your project have corresponding tests, you can use the dial gauge widgets for Requirements with Tests and Tests with Requirements. These widgets show the connection between the implemented functional requirements and component tests in the project. These metric results show the average percentage across units in the project.
The dashboard analyzes the requirements in your project to determine which requirements directly contribute to the functional implementation of the component and which requirements are for the overall project. The widget for:
Requirements with Tests determines if each functional requirement is linked to at least one test case or test iteration in the project.
Tests with Requirements determines if each test case or test iteration is linked to at least one functional requirement with link type
Verify.
For this example project, the requirements are in the interface control document, system requirements, and software requirements files in the driving assistant specification reference project. By verifying that your requirements and tests are properly linked, you can assess the status of requirements traceability and linkage for your models and maintain industry standards for tracking implemented and functional requirements.
A verification or test engineer needs to develop tests for this model. To see how existing software requirements currently relate to the implementation in the design, you can use the Requirements to Design trace view.
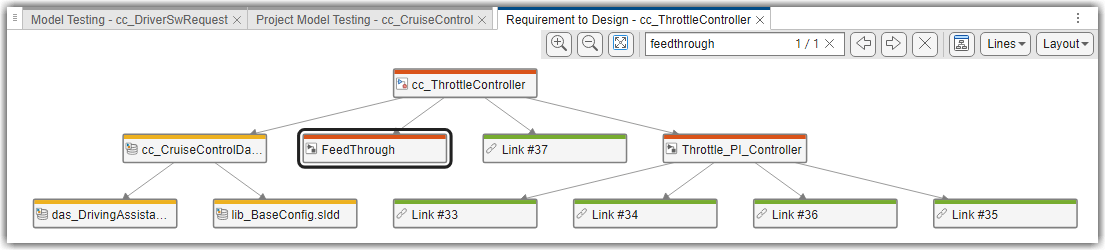
1. In the toolstrip, click the Traceability tab, click the Requirements to Design trace view, and in the Project panel, click cc_ThrottleController. The throttle controller needs to maintain vehicle speed control or allow manual throttle control when the system is inactive. The trace view shows the relationships between various requirements and subsystems in the model. The trace view shows individual requirements, links to the main block diagram for the unit, underlying subsystems, and data dictionaries involved.
2. In the toolstrip for the trace view, search for FeedThrough. The trace view highlights the subsystem.
The throttle controller model contains a FeedThrough subsystem that maintains the throttle signal integrity when the system is inactive. When the cruise control system is not in the ACTIVE mode, the throttle controller must pass the throttle value directly through without modification. The other requirements on the unit apply to the Throttle_PI_Controller subsystem, which applies control algorithms to adjust the throttle value to make sure the value does not exceed maximum or minimum thresholds. The system must calculate the appropriate throttle value when the cruise control system is active so that the throttle value stays within predefined limits. You can see the links to these requirements in the trace view. These requirements need tests to help validate that the throttle controller implements these functional behaviors.
In this example project, the throttle controller model uses cruise control data from a data dictionary file, cc_CruiseControlData.sldd, that requires information from base configuration and driving assistant specification data dictionaries. You can see these data dictionaries in yellow, connected to the main block diagram. If you point to the arrow connecting the main data dictionary to the main block diagram, you can see that the traceability relationship between these artifacts is a REQUIRES relationship.
3. View the direct artifact relationships, such as the direct connections between data dictionaries and model block diagrams, by clicking an artifact and checking the Artifact Neighbors panel. To view detailed information about an artifact, point to the artifact in the trace view.
Identify and Address Gaps in Model and Code Testing
The Project Model Testing dashboard provides an overview of the model and code testing statuses for the units in your project. When you identify issues in your model testing, code testing, and requirements traceability, you can use the links in the dashboard to navigate directly to the underlying Model Testing, SIL Code Testing, and PIL Code Testing dashboards and their detailed metric results.
The Artifact column of the Component Test Status section of the dashboard shows the valid Units in your project. If you do not see your model in the Artifact column, make sure that the model is a valid unit. To include or exclude certain models from the dashboard, you can specify which models are units by labeling them in your project and configuring the dashboard to recognize the label, as shown in Specify Models as Components and Units.
As you develop your models and tests, you can use the detailed metric results in the Model Testing, SIL Code Testing, and PIL Code Testing dashboards to assess the progress of model and code testing for an individual model. You can open the Model Testing, SIL Code Testing, and PIL Code Testing dashboards for a specific unit by clicking the hyperlinks for the unit in the Component Test Status table. The links in the Model Tests Passed column open the Model Testing Dashboard for the artifact in that row, the SIL Tests Passed column has links to the SIL Code Testing dashboard, and the PIL Tests Passed column links to the PIL Code Testing dashboard. For more information on the Model Testing Dashboard, see Explore Status and Quality of Testing Activities Using Model Testing Dashboard. For more information on the SIL Code Testing and PIL Code Testing dashboards, see View Status of Code Testing Activities for Software Units in Project.