Collect Compliance Data and Explore Results in the Model Advisor
This example shows how to collect model metric data by using the Metrics Dashboard. From the dashboard, explore detailed compliance results and fix compliance issues by using the Model Advisor.
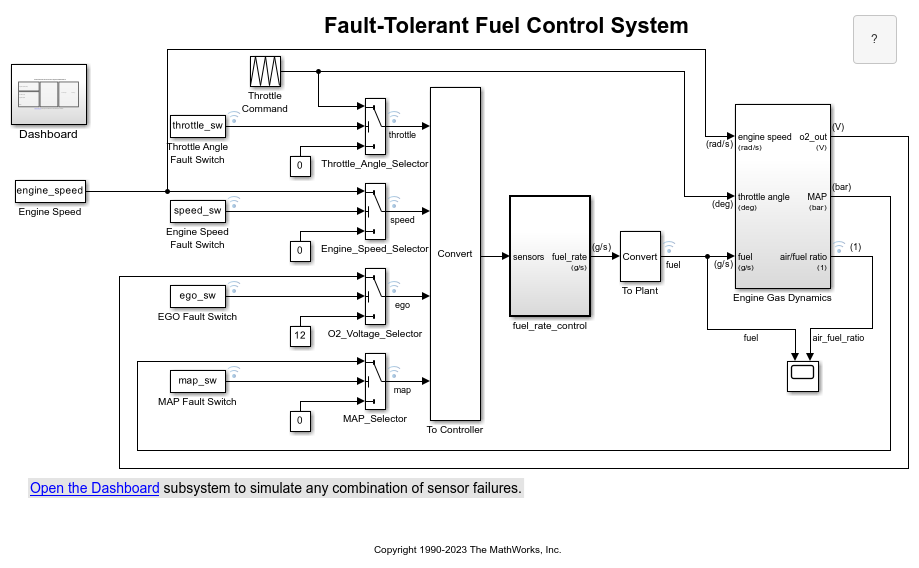
open_system('sldemo_fuelsys');
Open the Metrics Dashboard
On the Apps tab, open the Metrics Dashboard by clicking Metrics Dashboard.
Collect Model Metrics
To collect the metric data for this model, click the All Metrics icon.
Explore Compliance Results
Locate the MODELING GUIDELINE COMPLIANCE section of the dashboard. This section displays the percentage of High Integrity and MAB compliance checks that passed on each system. The bar chart shows the number of issues reported by the checks in the corresponding check group.

To see a table that details the number of compliance issues by component, click on the High Integrity bar in the bar chart. For compliance checks that analyze configuration settings, each check that does not pass adds one issue to the model on which it failed.
From the table, open the Throttle component in the model editor by clicking the component hyperlink in the table. The model editor highlights blocks in the component that have compliance issues.

Explore Compliance Results in the Model Advisor
In the Metrics Dashboard, return to the main dashboard page by clicking the Dashboard icon.
Click the High Integrity percentage gauge.
To see the status for each compliance check, click the Table view.
Expand the
sldemo_fuelsysnode.To explore check results in more detail, click the Check safety-related diagnostic settings for sample time hyperlink.
In the Model Advisor Highlight dialog box, click Check safety-related diagnostic settings for sample time hyperlink.
Fix a Compliance Issue
In the Model Advisor Report, the check results show the Current Value and Recommended Value of diagnostic parameters.
To change the Current Value to the Recommended Value, click the parameter. The Model Configuration Parameters dialog box opens.
Change the parameter settings.
Save your changes and close the dialog box.
Save the changes to the model.
Recollect Metrics
Return to the Metrics Dashboard.
To recollect the model metrics, click the All Metrics icon.
To return to the main dashboard page, click the Dashboard icon.
Confirm that the number of High Integrity check issues is reduced.