Collect Metric Data Programmatically and View Data Through the Metrics Dashboard
This example shows how to use the model metrics API to collect model metric data for your model, and then explore the results by using the Metrics Dashboard.
Collect Metric Data Programmatically
To collect all of the available metrics for the model sldemo_fuelsys, use the slmetric.Engine API. The metrics engine stores the results in the metric repository file in the current Simulation Cache Folder, slprj.
metric_engine = slmetric.Engine();
setAnalysisRoot(metric_engine,'Root','sldemo_fuelsys','RootType','Model');
evalc('execute(metric_engine)');
Determine Model Compliance with MAB Guidelines
To determine the percentage of MAB checks that pass, use the metric compliance results.
metricID = 'mathworks.metrics.ModelAdvisorCheckCompliance.maab';
metricResult = getAnalysisRootMetric(metric_engine, metricID);
disp(['MAAB compliance: ', num2str(100 * metricResult.AggregatedValue, 3),'%']);
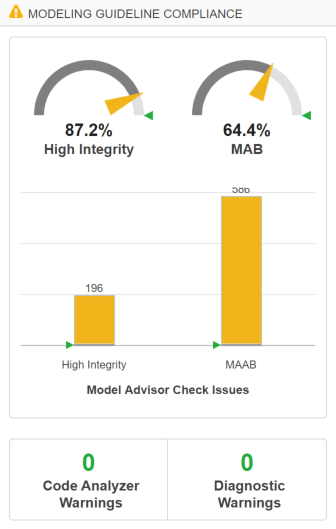
MAAB compliance: 64.4%
Open the Metrics Dashboard
To explore the collected compliance metrics in more detail, open the Metrics Dashboard for the model.
metricsdashboard('sldemo_fuelsys'); The Metrics Dashboard opens data for the model from the active metric repository, inside the active Simulation Cache Folder. To view the previously collected data, the slprj folder must be the same.
Find the MODELING GUIDELINE COMPLIANCE section of the dashboard. For each category of compliance checks, the gauge indicates the percentage of compliance checks that passed.

The dashboard reports the same MAB compliance percentage as the slmetric.Engine API reports.
Explore the MAB Compliance Results
Underneath the percentage gauges, the bar chart indicates the number of compliance check issues.
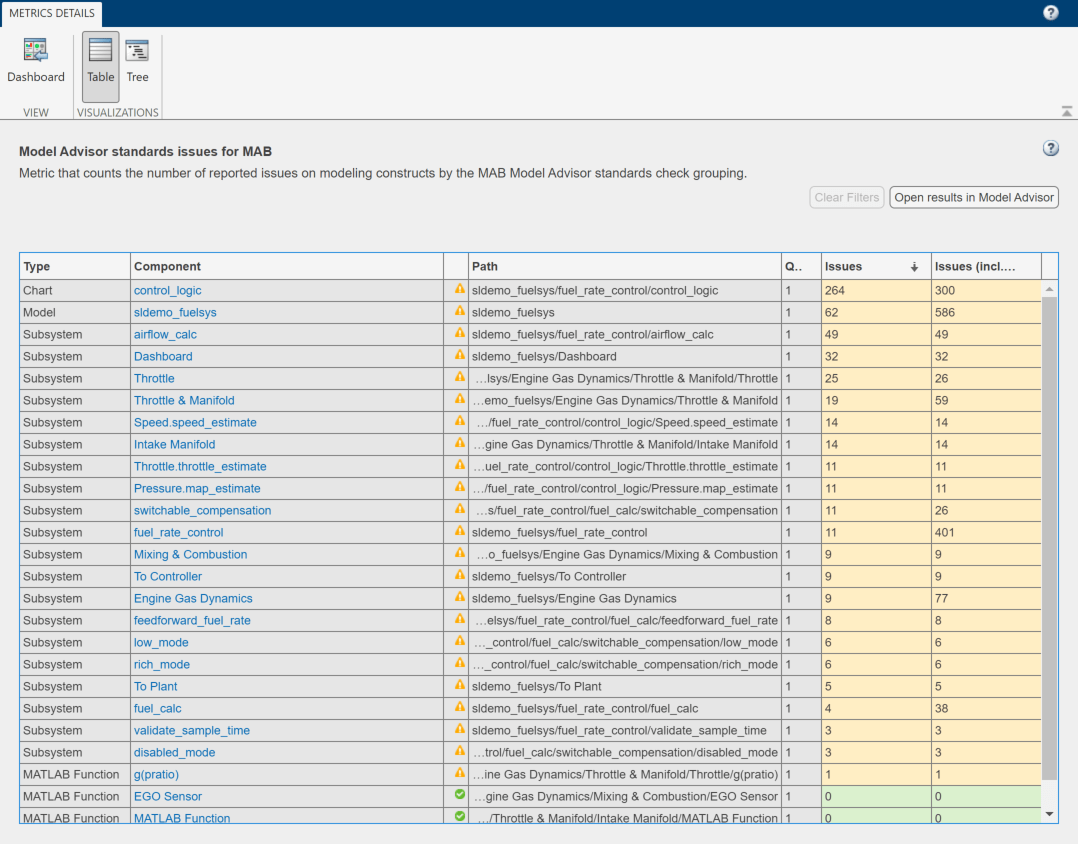
Click the MAAB bar in the bar chart to view a table of the Model Advisor Check Issues for MAB.
The table details the number of check issues per model component. To sort the components by number of check issues, click the Issues column.
