Implement MATLAB Functions in Simulink with MATLAB Function Blocks
MATLAB Function blocks enable you to define custom functions in Simulink® models by using MATLAB® code. Use these blocks when:
You have an existing MATLAB function that models custom functionality, or it is easy for you to create such a function.
Your model requires custom functionality that is not or cannot be captured in the Simulink graphical language.
You find it easier to model custom functionality by using a MATLAB function than by using a Simulink block diagram.
The custom functionality that you want to model does not include continuous or discrete dynamic states. To model dynamic states, use S-functions. See Author Blocks Using MATLAB S-Functions.
Calculate Mean and Standard Deviation with a MATLAB Function Block
This example starts with a model that includes a MATLAB Function block and guides you through how to customize the block to calculate the mean and standard deviation for a vector of values. Open the call_stats_block1 model to view the starting blocks. The model includes an empty MATLAB Function block and the blocks you need for the example.

Program the MATLAB Function Block
Program the block to calculate the mean and standard deviation for a vector of values. To open the MATLAB Function Block Editor, double-click the MATLAB Function block. A default function appears in the MATLAB Function Block Editor with two variables: one input and one output argument.

Define the function inputs and outputs by editing the function declaration statement:
function [mean, stdev] = stats(vals)
This statement defines a function called stats with three variables. The statement defines an input argument, vals, and two output arguments, mean and stdev.
On a new line after the function declaration statement, clear the existing code and add the following code:
% Calculates a statistical mean and a standard
% deviation for the values in vals.

len = length(vals);
mean = avg(vals,len);
stdev = sqrt(sum(((vals-avg(vals,len)).^2))/len);
plot(vals,"-+");

function mean = avg(array,size)
mean = sum(array)/size;
The final code looks like this:

Exit the editor by clicking the Up to Parent button ![]() . The block updates the port names. The function outputs
. The block updates the port names. The function outputs mean and stdev correspond to block output ports mean and stdev and the function input vals corresponds to the block input port vals.
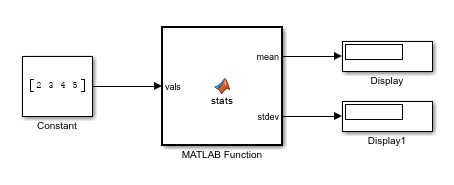
Complete the connections to the MATLAB Function block.

Save the model. To view a completed version of this model, open the call_stats_block2 model.
Check Properties for MATLAB Function Block Variables
You can check and manage properties for variables in MATLAB Function blocks. In this example, verify that the input argument vals inherits its type and size properties. Double-click the MATLAB Function block. Open the Symbols pane and the Property Inspector. In the Function tab, click Edit Data.

The Symbols pane displays the variable names in the Name column. The Type column determines the function argument port assignment and where it appears in the function declaration statement. In this example, vals is assigned to an input port. mean and stdev are assigned to output ports. If you change the Type entry for either variable, the function declaration statement also changes.
Check the properties for vals. In the Symbols pane, click the row for vals. The Property Inspector updates to show the properties for vals. The Scope property matches the Type column.

For more information on creating variables in the MATLAB Function block and setting properties, see Create MATLAB Function Block Variables and Set Properties for MATLAB Function Block Variables.
Simulate the Model
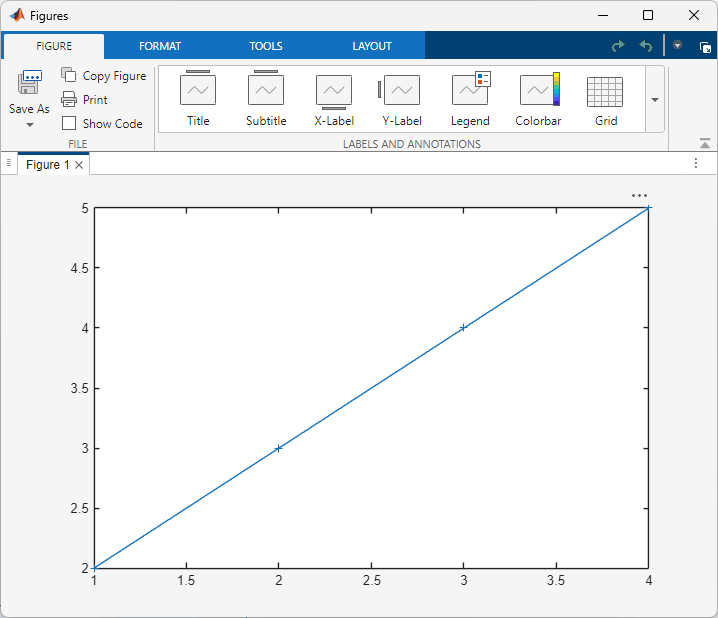
In Simulink, click Run to simulate the model. The model outputs the data from the function to the two Display blocks.

The block also plots the input data in a separate window.
See Also
MATLAB Function | MATLAB Function Block Editor | add_block
Topics
- Comparison of Custom Block Functionality
- Create MATLAB Function Block Variables
- Set Properties for MATLAB Function Block Variables
- Call MATLAB Function Files in MATLAB Function Blocks
- Configure MATLAB Function Blocks Programmatically