View Table of Data in Playback Block
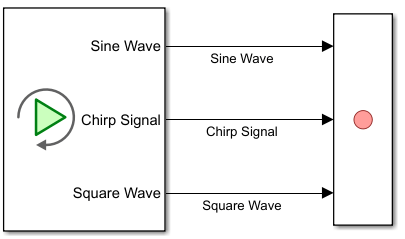
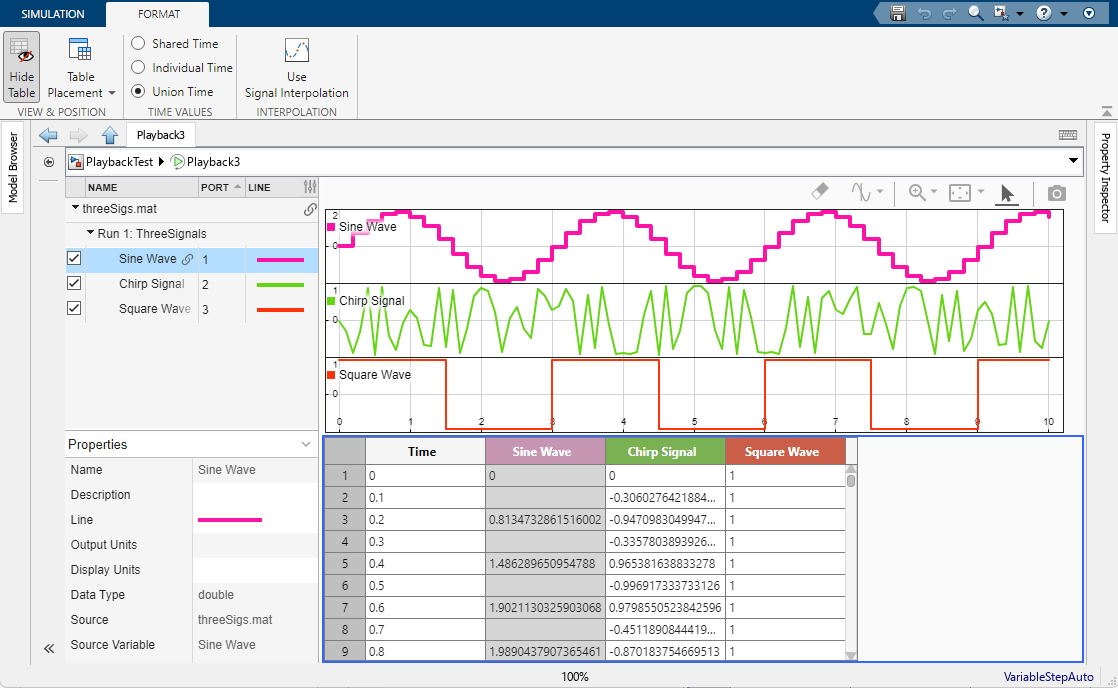
This example shows how to view signals in a data table in the Playback block. The PlaybackThreeSignals model contains a Playback block with three signals connected to a Record block. Signal data from the Playback block is loaded into the model during simulation. You can use the Playback block to visualize your data before loading it into your model. To view a sparklines visualization of the three signals that have been added to the Playback block, double-click the block. For more information about adding data to the Playback block, see Load Data Using Playback Block.
To view signal data in a table, on the Simulation tab, in the View section, click Show Table. By default, the Playback block creates a 2-by-1 layout with the sparklines visualization in the upper subplot and the data table in the lower subplot. Toggle which signals are plotted by selecting or clearing the check box next to each signal name in the list of signals. The table displays all plotted signals with color-coordinated columns. When you select a signal from the signal table or sparkline visualization, the Playback block also highlights the corresponding column in the data table.
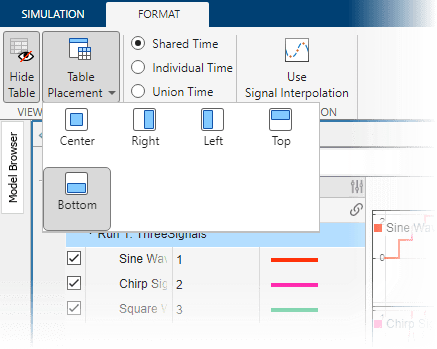
To change the subplot layout, select the data table. Then, on the Format tab, in the View & Position section, click Table Placement. To view only a the data table without the sparklines visualization, select Center.
Inspect Data Using Cursors
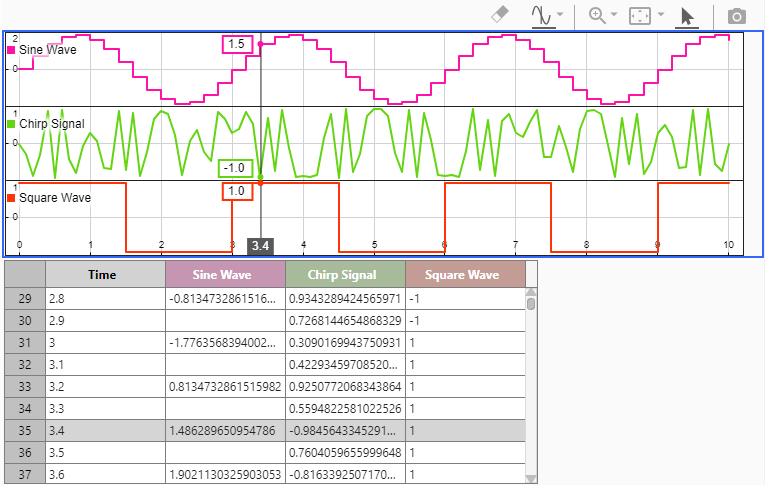
To inspect data using cursors, in the sparklines visualization, click the Show/hide data cursors button ![]() . As you move the data cursor in the sparklines visualization, the data table scrolls and highlights the row corresponding to the time indicated by the position of the cursor. When you use two cursors to inspect your data, the data table scrolls to row of the last cursor moved.
. As you move the data cursor in the sparklines visualization, the data table scrolls and highlights the row corresponding to the time indicated by the position of the cursor. When you use two cursors to inspect your data, the data table scrolls to row of the last cursor moved.
Examine Data in Table Using Different Time Column Formats
You can view signals in the data table using any of the three time formatting options described in this table.
Layout Option | Description | Table Format |
|---|---|---|
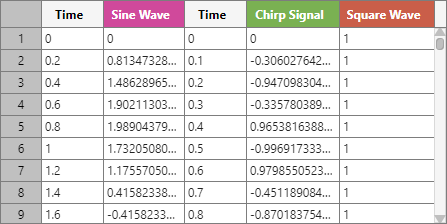
| Data is grouped by shared time columns. |
|
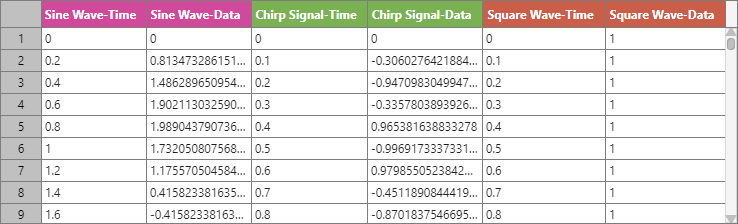
| Each signal is paired with a corresponding time column. |
|
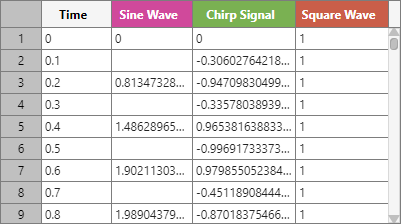
| Data is aligned with a single time column that includes every sample time between the signals. When a signal does not have a data value for a given time step, the cell is empty. To interpolate missing data values, on the Format tab, click Use Signal Interpolation. Use the Interp Method property in the Properties pane to view or change the interpolation method for a selected signal. |
|