Preview Signal Data
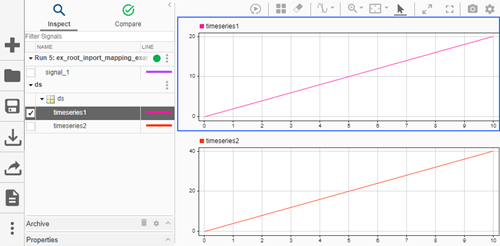
Preview input signal or bus data with the Signal Editor window or the
Simulation Data Inspector. You can access these windows from the Simulink.SimulationData.DatasetRef and Simulink.SimulationData.Dataset
plot object
functions. This topic describes using the Signal Editor window. For
more information on the Simulation Data Inspector, see Simulation Data
Inspector.
Preview input signal or bus data with the Signal Editor or Simulation Data Inspector windows.
For
Simulink.SimulationData.DatasetorSimulink.SimulationData.DatasetRefelements, use theplotfunction on the dataset.By default, the plot opens with the Simulation Data Inspector.

To use the Signal Editor window, use the
'preview'option.
In the Signal Editor window, explore the plots using the Measure and Zoom & Pan sections on the toolbar.
In the Measure section, use the Data Cursors button to display one or two cursors for the plot. These cursors display the T and Y values of a data point in the plot. To view a data point, click a point on the plot line.
In the Zoom & Pan section, select how you want to zoom and pan the signal plots. Zooming is only for the selected axis.
Type of Zoom or Pan Button to Click Zoom in along the T and Y axes.

Zoom in along the time axis. After selecting the icon, on the graph, drag the mouse to select an area to enlarge.

Zoom in along the data value axis. After selecting the icon, on the graph, drag the mouse to select an area to enlarge.

Zoom out from the graph.

Fit the plot to the graph. After selecting the icon, click the graph to enlarge the plot to fill the graph.

Pan the graph up, down, left, or right. Select the icon. On the graph, hold the left mouse button and move the mouse to the area of the graph that you want to view.

See Also
From File | Simulink.SimulationData.DatasetRef | Simulink.SimulationData.Dataset | plot