Access Data in MATLAB Function During Simulation
You can stream signal data to a MATLAB® callback function during simulation using the Data Access functionality in the Instrumentation Properties for a signal. The function you provide receives data in packets asynchronously throughout the simulation. The callback function executes each time it receives new data. You can write a callback function to process signal data during simulation or to create a custom visualization of a signal. The callback function does not affect signal values in your model. This example illustrates the steps required to access signal data during simulation using a simple callback function that plots the signal.
Note
Data access only supports 1-D and 2-D matrix signals and does not support Rapid Accelerator mode, referenced models, or virtual bus signals.
Before R2025a: Data access does not support fixed-point data.
Write Callback Function for Data Access
The data access callback function always receives signal data as the first argument. You can choose whether to send the simulation time and a parameter. When you include all three arguments, simulation time is the second argument. Your callback function can be specific to a single signal, or you can use the same callback to process and visualize multiple signals. The callback function only has access to data for a single signal at a time. This example creates a callback function that receives signal data, time, and a parameter used to identify which signal the function is processing for a given call.
Note
The data access callback function receives nonvirtual bus data as a structure of arrays that matches the hierarchy of the bus.
Author your callback function in an .m file with the same name as
your function. For more information about writing MATLAB functions, see Create Functions in Files. The example callback function uses the optional
parameter to assign a numerical identifier to each signal. The parameter is used to create a
unique figure for each signal and assign each signal a different line color. To accumulate
signal data on the plot, the callback includes hold on. For each call to
the callback, the function receives a portion of the signal data. You can use the callback
to accumulate the packets if desired.
function plotSignals(y,time,sigNum)

    figure(sigNum)

    if isequal(sigNum,1)
        marker = "ro-";
    elseif isequal(sigNum,2)
        marker = "go-";
    else
        marker = "bo-";
    end

    hold on;
    plot(time,y,marker);

end
The callback function provides no return values. If you specify the function with returns, the return data is discarded.
Tip
Use assignin to access data from the
callback function in the base workspace.
Save the callback function in a location on the MATLAB path. If the location where you save the callback is not on the path, you can add it to the path. Right-click the directory containing the callback in the Current Folder section in MATLAB and select Add to Path.
Configure Signals for Data Access
Configure signals in the slexAircraftExample model to use the callback from the previous section.
Open the slexAircraftExample model.
mdl = "slexAircraftExample";
open_system(mdl)
To access data for a signal with the data access callback, you must log the signal. To mark the alpha, rad, q rad/sec, and Stick signals for logging, select the signals. Then, right-click the selected signals and from the context menu, select Log Selected Signals.
Alternatively, you can use the Simulink.sdi.markSignalForStreaming function to mark the signals for logging.
lines = get_param('slexAircraftExample','Lines');
q_handle = lines(1).Handle;
alpha_handle = lines(2).Handle;
Stick_handle = lines(6).Handle;

Simulink.sdi.markSignalForStreaming(q_handle,"on")
Simulink.sdi.markSignalForStreaming(alpha_handle,"on")
Simulink.sdi.markSignalForStreaming(Stick_handle,"on")
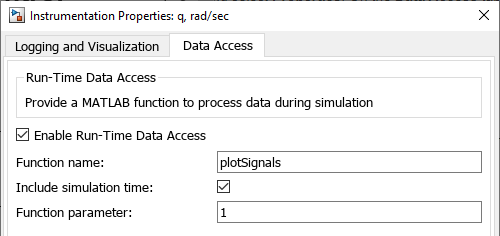
To configure data access for the each signal, right-click the logging badge and select Properties. In the Instrumentation Properties dialog box, on the Data Access tab, you can specify the name of your callback function, whether the callback function takes time as an argument, and the optional parameter value.
In the Instrumentation Properties dialog box, on the Data Access tab:
In the Function name text box, enter the name of the callback,
plotSignals.Select Include simulation time.
In the Function parameter text box, enter
1for theq, rad/secsignal, enter2for thealpha, radsignal, and enter3for theSticksignal.

Simulate the model. The callback generates Figures 1, 2, and 3 to display the q, rad/sec, alpha,rad, and Stick signals during simulation.
sim(mdl);

You can modify the callback function to create a custom visualization or to create a plot of processed signal data. Errors related to the data access callback function do not interrupt simulation. The errors surface in the Diagnostic Viewer as a warning.
See Also
Instrumentation
Properties | assignin | Simulink.sdi.markSignalForStreaming