Zero-Pole Analysis
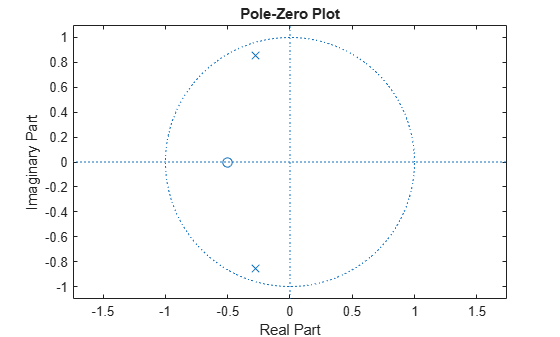
The zplane function plots poles and zeros of a linear system. For example, a simple filter with a zero at -1/2 and a complex pole pair at and is
zer = -0.5;
pol = 0.9*exp(j*2*pi*[-0.3 0.3]');
To view the pole-zero plot for this filter you can use zplane. Supply column vector arguments when the system is in pole-zero form.
zplane(zer,pol)

To use zplane for a system in transfer function form, supply row vector arguments. In this case, zplane finds the roots of the numerator and denominator using the roots function and plots the resulting zeros and poles.
[b,a] = zp2tf(zer,pol,1);
zplane(b,a)
See Discrete-Time System Models for details on zero-pole and transfer function representation of systems.