Walsh-Hadamard Transform for Spectral Analysis and Compression of ECG Signals
Use an electrocardiogram (ECG) signal to illustrate working with the Walsh-Hadamard transform. ECG signals typically are very large and need to be stored for analysis and retrieval at a future time. Walsh-Hadamard transforms are particularly well-suited to this application because they provide compression and thus require less storage space. They also provide rapid signal reconstruction.
Start with an ECG signal. Replicate it to create a longer signal and insert some additional random noise.
xe = ecg(512);
xr = repmat(xe,1,8);
x = xr + 0.1.*randn(1,length(xr));
Transform the signal using the fast Walsh-Hadamard transform. Plot the original signal and the transformed signal.
y = fwht(x);

subplot(2,1,1)
plot(x)
xlabel('Sample index')
ylabel('Amplitude')
title('ECG Signal')

subplot(2,1,2)
plot(abs(y))
xlabel('Sequency index')
ylabel('Magnitude')
title('WHT Coefficients')
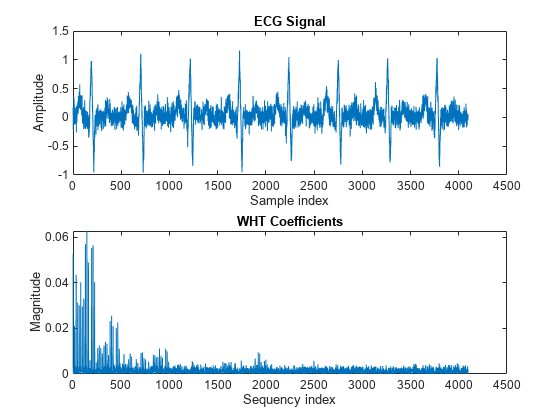
The plot shows that most of the signal energy is in the lower sequency values, below approximately 1100. Store only the first 1024 coefficients (out of 4096). Try to reconstruct the signal accurately from only these stored coefficients.
y(1025:length(x)) = 0;
xHat = ifwht(y);

figure
plot(x)
hold on
plot(xHat)
xlabel('Sample Index')
ylabel('ECG Signal Amplitude')
legend('Original','Reconstructed')
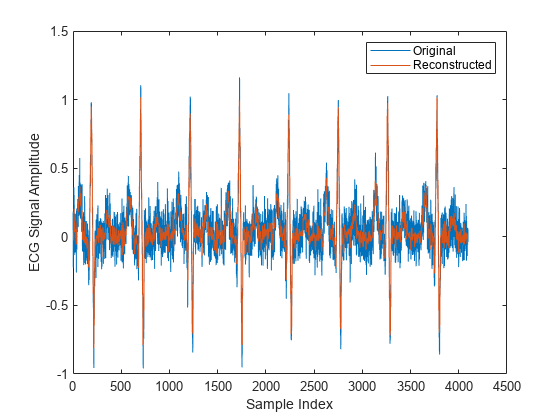
The reproduced signal is very close to the original but has been compressed to a quarter of the size. Storing more coefficients is a tradeoff between increased resolution and increased noise, while storing fewer coefficients can cause loss of peaks.