Read Occupancy Grid
Libraries:
ROS Toolbox /
ROS 2
Description
The Read Occupancy Grid block extracts map data from a ROS 2 occupancy grid message. It accepts a
nav_msgs/OccupancyGrid message at the Msg input port and
outputs the grid as a matrix. Based on the selected output type, the Grid port
returns a probability occupancy grid with values in the range [0 1] or a
binary occupancy grid with cell values of 0 and
1.
The block can also output an ErrorCode that indicates the conversion status, including whether the message is truncated or the occupancy map is empty. Use block parameters to specify the maximum grid size, set replacement values for unknown cells, and define the threshold for binary conversion.
You can enable variable-size signals when the map dimensions change at run time. To configure grid size and message details automatically, use the Configure using ROS 2 option with an active topic on a ROS 2 network.
Examples
This example shows how to visualize a static occupancy grid in Simulink® by subscribing to ROS 2 messages published on the /occupancy_grid topic. It reads a .pgm image file, converts it to an occupancy grid, and sends the map as a nav_msgs/OccupancyGrid message to the Simulink model. It then uses the Read Occupancy Grid block to decode the message and display it using a Video Viewer block.
To run this example, you must use two MATLAB sessions, one for publishing the ROS 2 message and one for running the model.
Create and Publish Occupancy Grid from Image
Run this code in the first MATLAB session to read a grayscale image, convert it to an occupancyMap object, and publish the message on the /occupancy_grid topic.
% Read the PGM image
image = imread('playpen_map.pgm');

% Crop region of interest
imageCropped = image(750:1250, 750:1250);

% Normalize and convert to occupancy probability
imageNorm = double(imageCropped)/255;
imageOccupancy = 1 - imageNorm;

% Convert to occupancyMap object
map = occupancyMap(imageOccupancy, 20);  % 20 cells/meter

% Create ROS 2 OccupancyGrid message
msg = ros2message('nav_msgs/OccupancyGrid');
msg = rosWriteOccupancyGrid(msg, map);

% Set up ROS 2 node and publisher
node = ros2node('occupancy_grid_node');
pub = ros2publisher(node, '/occupancy_grid', 'nav_msgs/OccupancyGrid');

% Publish message continuously
disp("Publishing occupancy grid on /occupancy_grid...");
Publishing occupancy grid on /occupancy_grid...
while true
    send(pub, msg);
    pause(0.5);  % Publish at 2 Hz
end
Open Simulink Model
In a second MATLAB session, open the model that subscribes to the /occupancy_grid topic. The model includes these components.
open_system('listen_occupancy_grid.slx');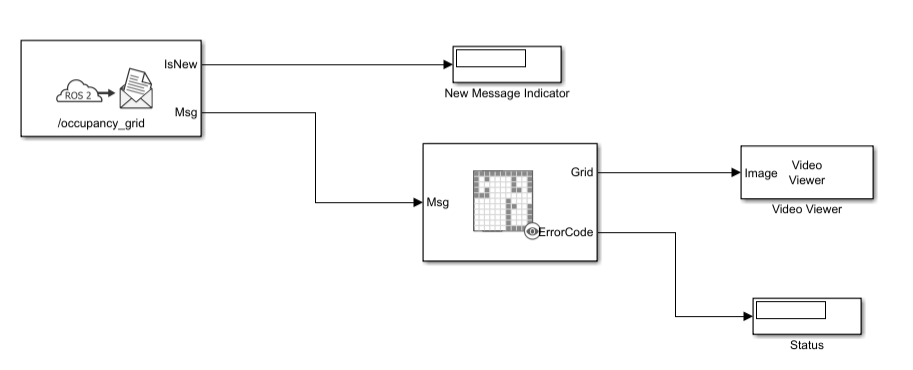
Subscribe — Subscribes to
/occupancy_gridand outputs the message and update flag.New Message Indicator — Indicates when a new message is received.
Read Occupancy Grid — Converts the message into a 2-D matrix representing the occupancy grid.
Video Viewer — Displays the occupancy grid visually as an image.
Status Indicator — Displays error codes from the Read Occupancy Grid block.
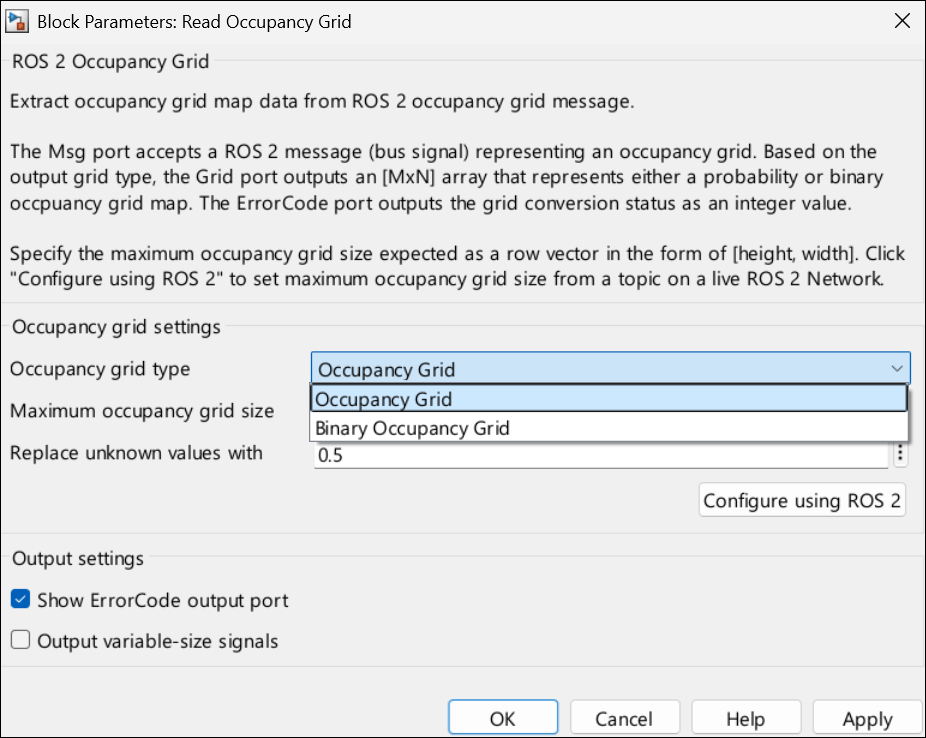
In the Read Occupancy Grid block, set the Occupancy grid type parameter to the default value of Occupancy grid, which decodes messages created using the rosWriteOccupancyGrid function. The block outputs a matrix with values in the range [0, 1], where each element represents the occupancy probability of a map cell. The block also outputs an ErrorCode signal. An error code of 0 indicates successful conversion, while other values correspond to issues such as truncated data or oversized maps.
Run Simulink Model to Visualize Map
Start the simulation in Simulink while the MATLAB script is running. When the simulation runs:
The subscriber receives new occupancy grid messages.
The grid is decoded and rendered in the Video Viewer block.
The New Message Indicator flashes with every incoming message.
The Status Indicator shows the conversion status based on the error code.
You can see the cropped occupancy map appearing in the Video Viewer in near real time, updated continuously at 2 Hz.
sim('listen_occupancy_grid.slx');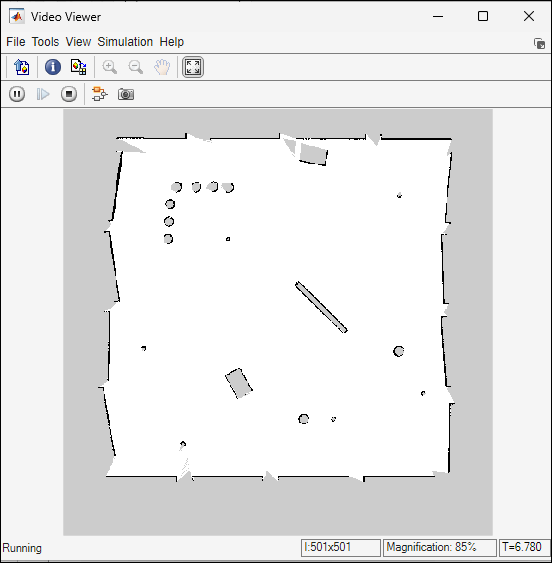
Use Binary Occupancy Grid for Logical Maps
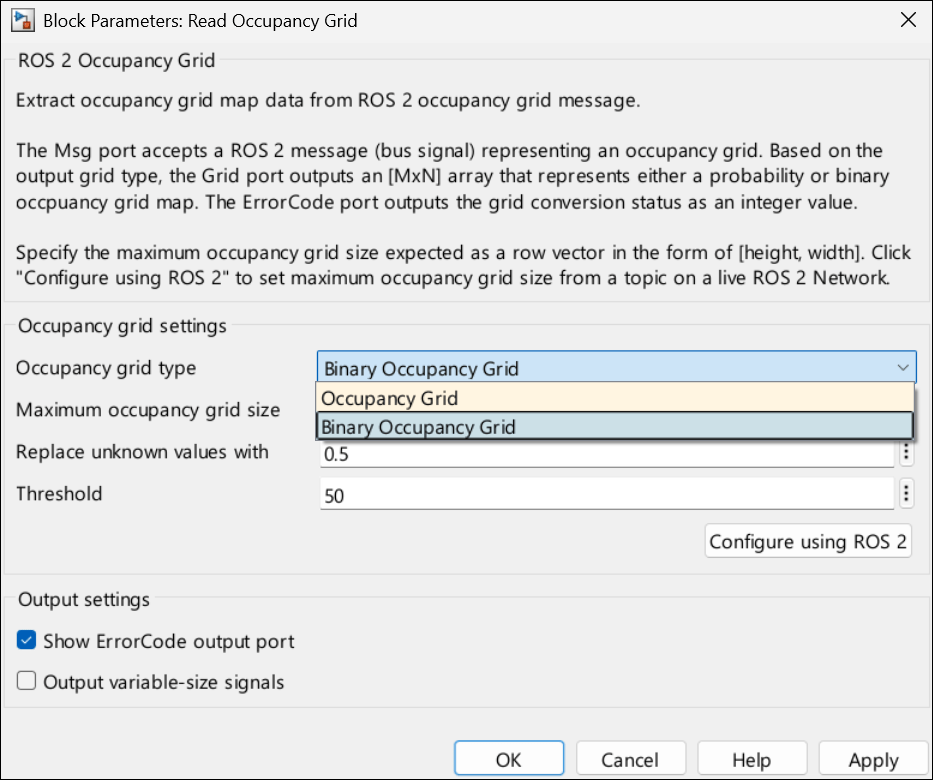
For a logical representation of free and occupied cells, you can configure the Read Occupancy Grid block to output a binary map.
To do so, set the Occupancy grid type parameter to Binary occupancy grid and Threshold to a value that separates occupied and free cells. In this mode, the block compares occupancy values against the threshold and outputs 1 for occupied cells and 0 for free cells. This example sets the Threshold value to 50.
To view the binary occupancy map, start the simulation in Simulink while the MATLAB script is running.
sim('listen_occupancy_grid.slx');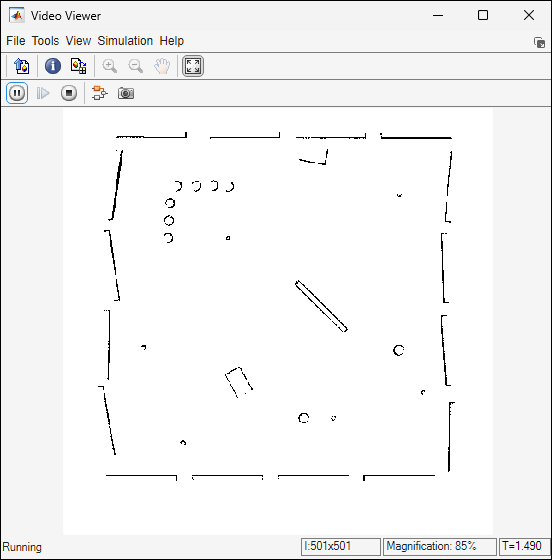
You can use the binary occupancy grid mode when the application requires a simplified logical map with only free and occupied cells. This mode is suited for tasks such as obstacle detection, path planning, or any downstream logic that operates on binary masks. It is also useful on memory-constrained systems and when you decode messages published using the rosWriteBinaryOccupancyGrid function.
Ports
Input
Output
Parameters
Extended Capabilities
Version History
Introduced in R2026a