diskmarginoptions
Customize disk-based stability-margin plots
Description
opts = diskmarginoptionsdiskmarginplot
and wcdiskmarginplot. You can then use dot notation to change option values. Use
opts to customize the plot appearance.
opts = diskmarginoptions('cstprefs')
Examples
Plot the disk margins as a function of frequency of a system with the following open-loop response.
L = tf(25,[1 10 10 10]);
For the plot, specify the following attributes:
Frequency units: Hz
Gain margins on a log scale, in absolute units
Grid on
opts = diskmarginoptions;
opts.FreqUnits = 'Hz';
opts.MagScale = 'log';
opts.MagUnits = 'abs';
opts.grid = 'on';

diskmarginplot(L,opts)

Plot the worst-case disk margins as a function of frequency of a system with the following open-loop response.
a  = ureal('a',10,'PlusMinus',[-4,4]);
L = tf(25,[1 a a a]);
For the plot, use the default preferences specified in your Control System Toolbox™ preference, except specify the following attributes:
Frequency units: Hz
Gain margins on a log scale, in absolute units
Grid on
opts = diskmarginoptions('cstprefs');
opts.FreqUnits = 'Hz';
opts.MagScale = 'log';
opts.MagUnits = 'abs';
opts.grid = 'on';

w = {2*pi*1e-3,2*pi*10};   % rad/s
wcdiskmarginplot(L,w,opts)
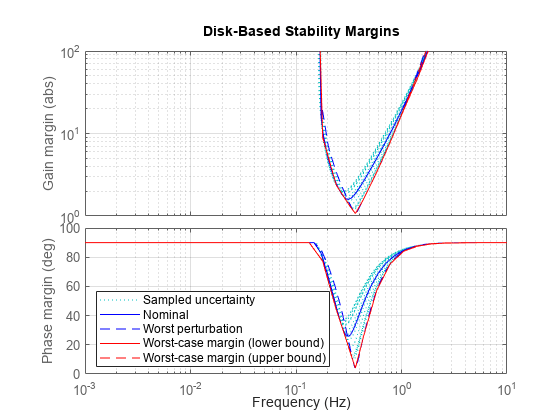
The plot you obtain might differ in appearance, depending on your current Control System Toolbox preference settings. (See Specify Toolbox Settings for Linear Analysis Plots.)
Output Arguments
Version History
Introduced in R2020a