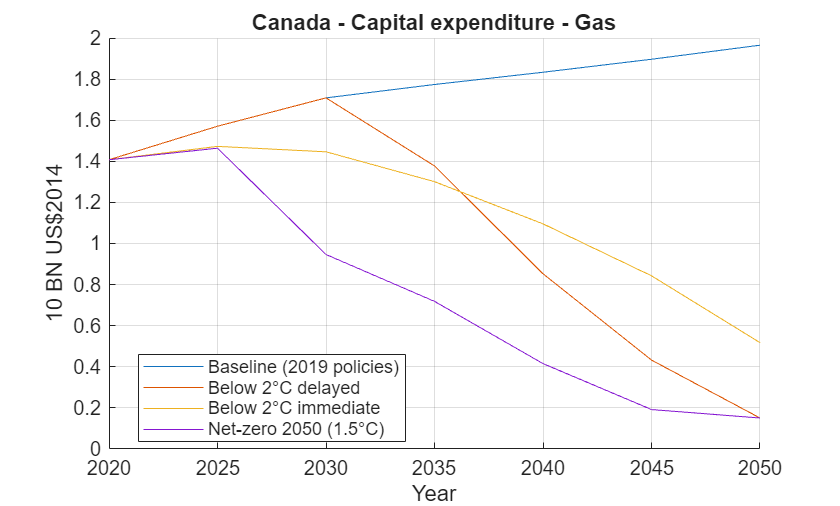
plot
Description
plot( plots
the climate scenario data contained in the cs,Name=Value)climateScenario
object, cs. Select the data for your plot by specifying name-value
arguments for the identifiers. For example,
plot(cs,Region="Canada",Variable="Carbon price") plots the price of
carbon in Canada.
h = plot(
returns a cs,Name=Value)Line object or an array of Line objects. Use
the figure handle h to modify properties of the plot after creating
it.
Examples
Input Arguments
Name-Value Arguments
Version History
Introduced in R2025a
See Also
climateScenario | query | groupRegions | sumVariables | divideVariables | shockVariables
