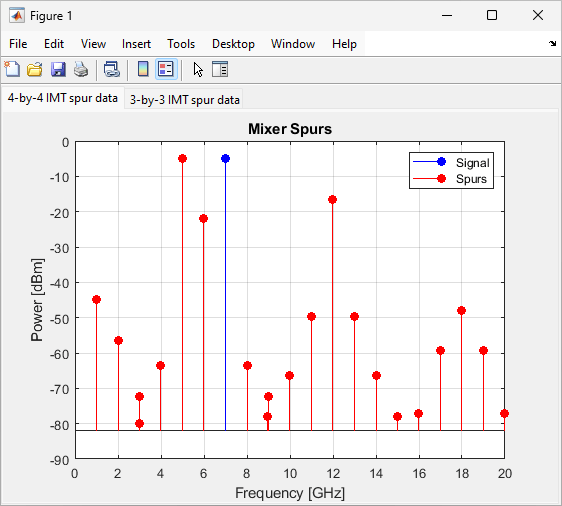
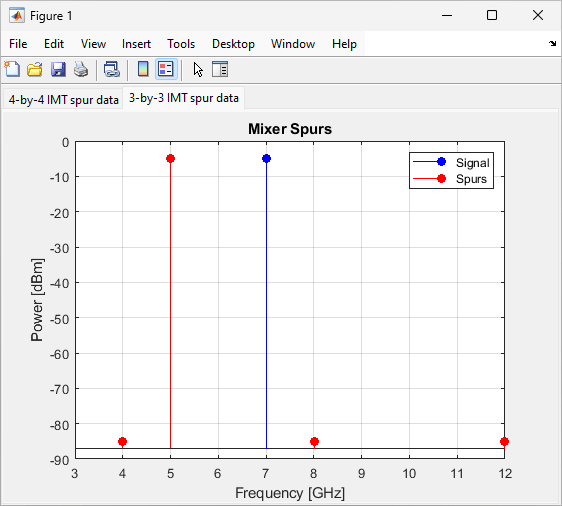
rfplot
Description
rfplot(___, plots the spur
and the spur-free zones of the Name=Value)mixerIMT object using additional options.
Specify the name-value argument after any of the input argument combinations in the previous
syntaxes. (since R2024a)
Examples
Input Arguments
Name-Value Arguments
Tips
In addition to plotting the mixer spurs, you can also use the rfplot function to:
Plot the S-parameter data.
Plot the cumulative RF budget result versus the cascade input frequency.
Plot the input reflection coefficient and transducer gain of a matching network.
![Figure contains an axes object. The axes object with title Mixer Spurs, xlabel Frequency [GHz], ylabel Power [dBm] contains 2 objects of type stem. These objects represent Signal, Spurs.](../../examples/rf/win64/PlotMixerSpurOfIMTMixerExample_01.png)


