GPU Monitor
R2026bDescription
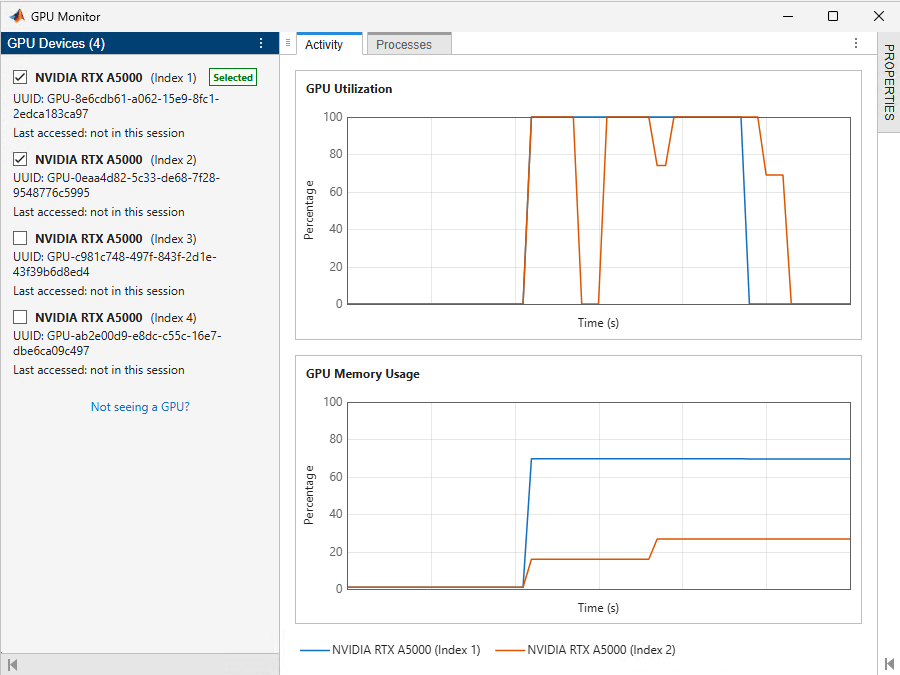
The GPU Monitor is an interactive tool for monitoring your GPU utilization, memory usage, and processes in real time.
Monitor your GPU to verify that your code is running on the GPU and identify inefficiencies and bottlenecks in your GPU computing code.
Open the GPU Monitor
Parallel panel : In the GPU Environment section, to the right of the GPU that you want to monitor, click the More actions button , then select Monitor.
MATLAB® Toolstrip: On the Home tab, in the Environment section, select Parallel > GPU Monitor
Examples
This example shows how to use the GPU Monitor to identify performance bottlenecks in your GPU code.
Open the GPU Monitor. In Parallel panel , to the right of the GPU that you want to monitor, click the More actions button , then select Monitor.
Prepare code to run on the GPU.
A = rand(30000,"gpuArray");
b = rand(30000,1,"gpuArray");

function [x,res] = myGPUFunction(A,b)

%Solve.
x = A\b;

% Calculate 2-norm of the residual.
res = norm(A*x - b);

end
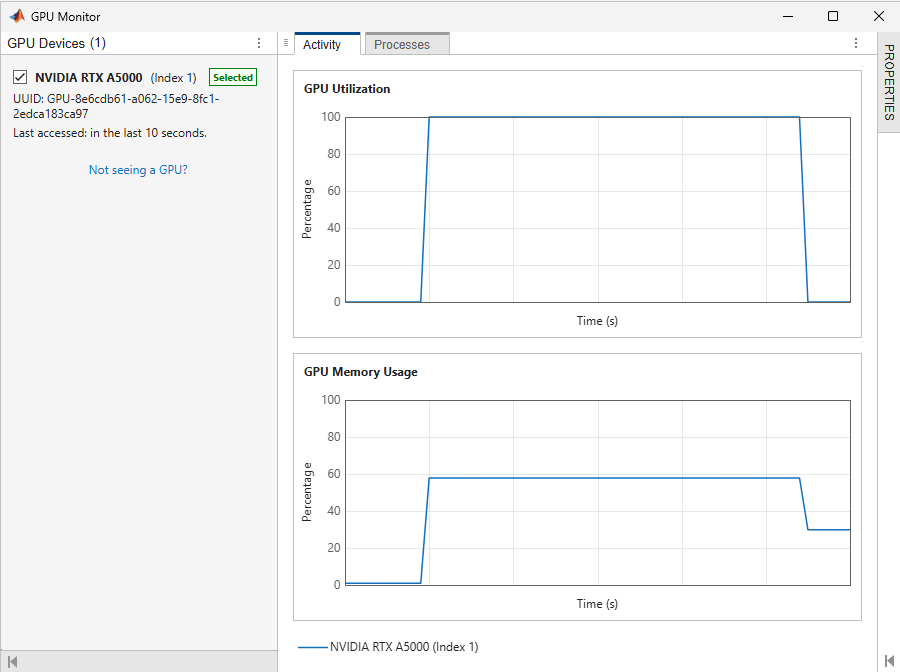
Run the code and, while the code runs, monitor the GPU utilization and memory usage in the Activity tab of the GPU monitor.
[x,res] = myGPUFunction(A,b);
For this code and GPU, you can observe that the utilization rises and stays high for several seconds and a small portion of memory is used.
For information about how to interpret and react to the metrics you see in the GPU Monitor, see Improve Performance Using GPU Monitor Metrics.
Related Examples
Parameters
The GPU Devices panel lists GPU devices available for monitoring. Select the check boxes next to the GPUs that you want to monitor.
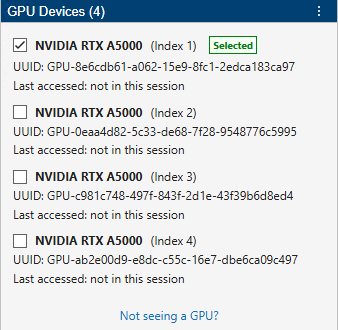
If a GPU that you expected to see is not listed, click Not seeing a GPU?.
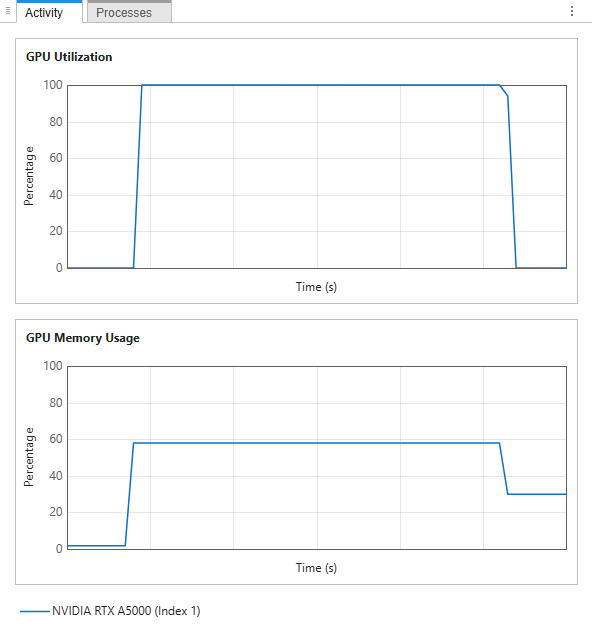
The Activity tab shows real-time plots of:
GPU Utilization — A measure of how busy a GPU is over time, expressed as a percentage. Specifically, the utilization is the percent of time over the past second during which one or more GPU kernels were executing on the GPU.
GPU Memory Usage — The percentage of the total GPU memory in use.
The plots show the last 60 seconds of data.
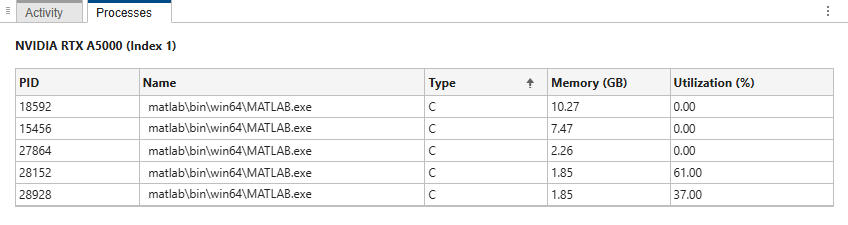
The Processes tab shows tables of the processes running on the GPUs being monitored. The columns of the tables contain these properties:
PID — The ID of the process utilizing GPU resources.
Process Name — The name of the process.
Process Type — The type of process, specified as
C(compute),G(graphics), orC+G(compute and graphics).Memory — The GPU memory used by the process in gigabytes.
Utilization — The utilization of the GPU by the process, expressed as a percentage.
Note
If your GPU is using the WDDM driver model, then you cannot monitor the per-process GPU memory usage and it will show as N/A. You can still use the Activity tab to monitor the total GPU memory usage.
The Properties panel shows properties of the GPUs being monitored. Only a subset of the properties are displayed by default. To see more, click Show all properties.
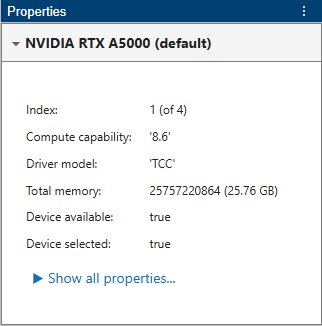
The properties are the same as those reported by the gpuDevice
function. For a detailed description of the properties, see gpuDevice.
Version History
Introduced in R2026b

