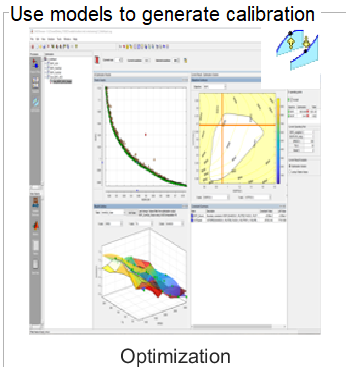
Calculate Optimal Current Lookup Tables for Motor
To calculate optimal current lookup tables for the motor, set up torque per ampere (TPA) as the target to maximize.
Note
If creating lookup tables as a function of motor torque, use Trq in place of TrqGrid, and use the lookup tables from Is and Iq in place of Is_Grid and Iq_Grid in these steps.
Create the function model TPA.
In the CAGE Browser toolbar, use the New Function Model wizard to create the function
TPA =
                    TrqGrid/Is_TrqGrid
.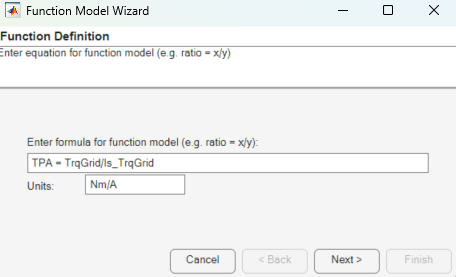
In the CAGE Browser, verify that the function model has this description:
TPA—Id,n,TrqPercent

Create Lookup Tables from Model
Create tables that the Model-Based Calibration Toolbox™ optimizers uses to store the optimized parameters. For this example, the tables are:
d-axis current, Id, as a function of motor torque percent,
TrqPercent, and motor speed,nq-axis current, Iq, as a function of motor torque percent,
TrqPercent, and motor speed,n
In the CAGE Browser, click Lookup Tables and Tradeoff. In the Create Lookup Tables from Model dialog box, select
Iq_TrqGrid. Click Next.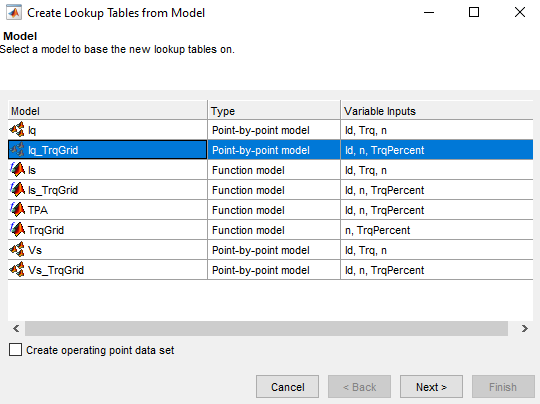
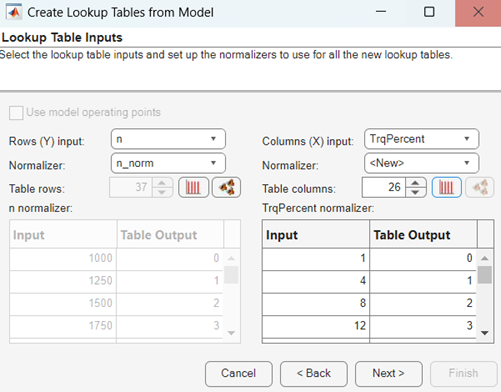
In the Create Lookup Tables from Model dialog box:
Clear Use model operating points.
Set Normalizer to n_norm to select existing breakpoints for
n.Set Rows (Y) input to
n.Set Columns (X) input to
TrqPercent.Click
 to edit breakpoints for
TrqPercent. Select Freeform Vector and enter[1 4:4:100].Click Next.
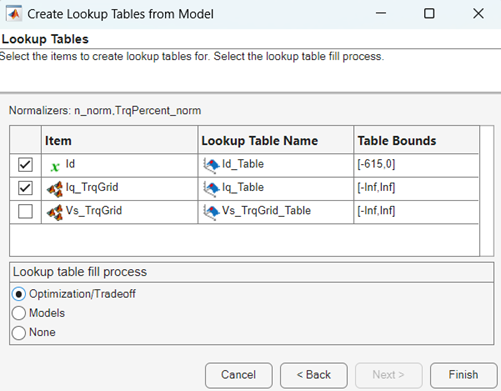
In the Create Lookup Tables from Model dialog box:
Select
IdandIq_TrqGrid.Update the lookup table name for
Iq_TrqGridtoIq_Table.Click Finish.
In the CAGE Browser, examine the tables.

Run Optimization on TPA
For this example, run an optimization with these specifications:
Current magnitude, Is_TrqGrid, less than or equal to
615AVoltage magnitude Vs_TrqGrid, less than or equal to
222.8V
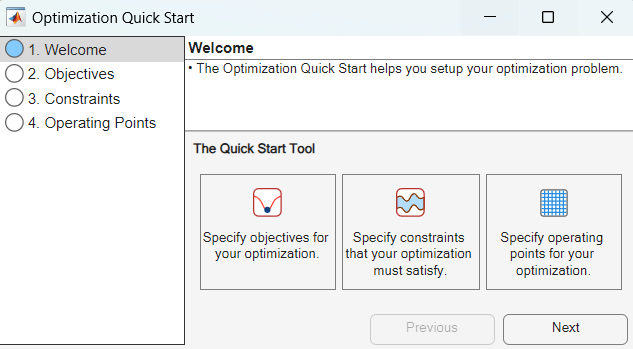
In the CAGE Browser, click Optimization.
The Optimization Quick Start dialog box opens to guide you through the optimization setup. Click Next.
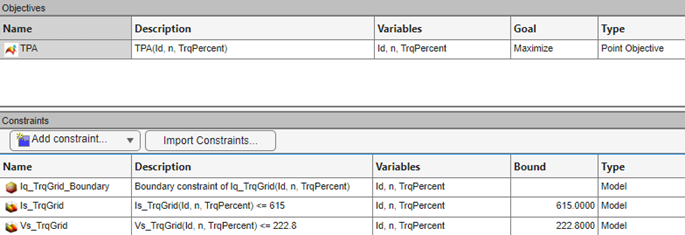
In the Optimization Quick Start dialog box on the Objectives tab:
From the Model list, select
TPA.From the Goal list, select
Maximize.
The Variable
Idis automatically selected to optimize. Click Next.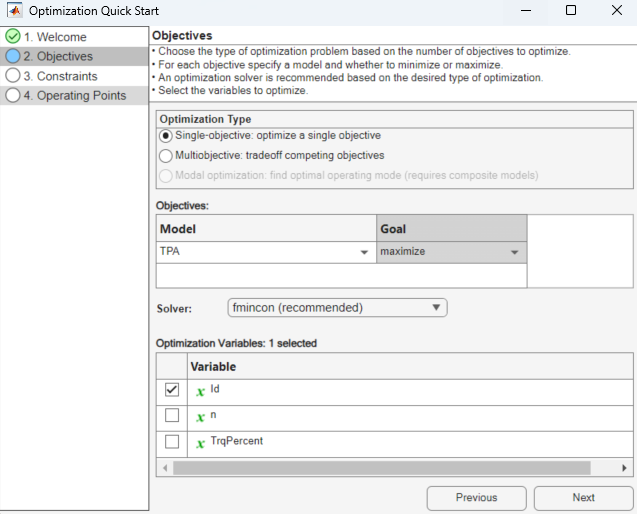
In the Optimization Quick Start dialog box on the Constraints tab, add the optimization constraint for the current magnitude,
Is_TrqGrid <= 615, and voltage magnitude,Vs_TrqGrid <= 222.8. Then, click Next.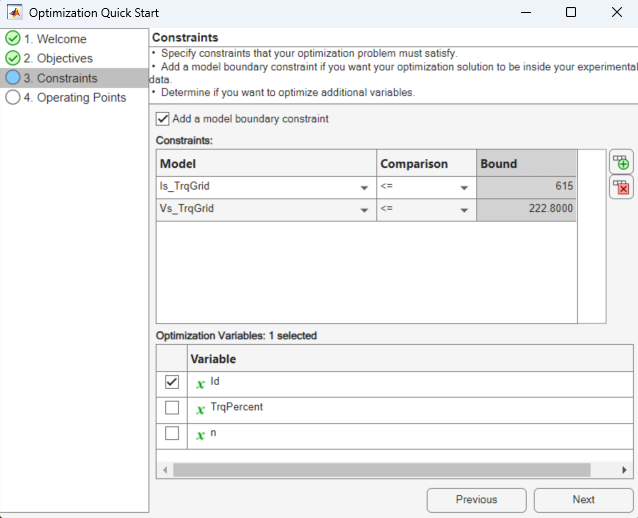
In the Optimization Quick Start dialog box on the Operating Points tab:
From the Operating points list select
BreakpointsandId_Table(n,TrqPercent).Under Optimize operating points, select Point: optimize each operating point separately.
Click Apply. Then, click Close.

In the CAGE Browser, carefully verify the Objectives and Constraints.
In the CAGE Browser, click Run.
Fill Lookup Tables
The lookup tables automatically fill after the optimization runs.

Id_Tablefills withId.Iq_Tablefills withIq_TrqGrid.
Review the results for
Id_Table. The results are similar to the results shown here.
Review the results for
Iq_Table. The results are similar to the results shown here.
Select File > Save Project. Save the
gs_example.cagfile to theworkfolder.