rgbplot
Plot colormap
Syntax
Description
Examples
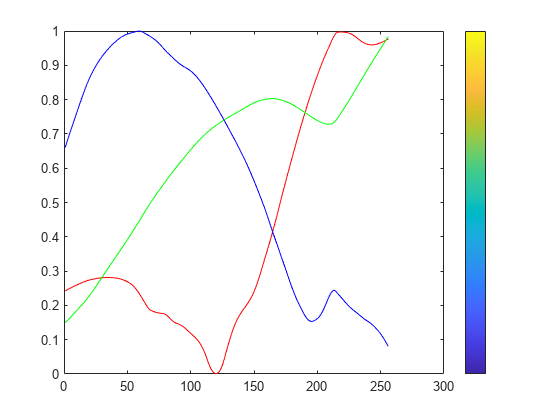
Plot the parula colormap, and display a colorbar as a visual reference.
rgbplot(parula)
hold on
colormap(parula)
colorbar('Ticks',[])

Create a custom colormap and plot it. Then display a colorbar as a visual reference.
r = (0:.1:.9)';
g = r.^1.8;
b = r.^2.1;
mymap = [r g b];
rgbplot(mymap)
hold on
colormap(mymap)
colorbar('Ticks',[])

Input Arguments
Colormap to plot, specified as a three-column matrix of RGB triplets. An RGB triplet is a three-element row vector whose elements specify the intensities of the red, green, and blue components of a color. The intensities must be in the range [0, 1]. For example, here is a colormap that contains five colors:
map = [0.2 0.1 0.5
    0.1 0.5 0.8
    0.2 0.7 0.6
    0.8 0.7 0.3
    0.9 1 0];
This table lists the RGB triplet values for common colors.
| Color | RGB Triplet |
|---|---|
| yellow | [1 1 0] |
| magenta | [1 0 1] |
| cyan | [0 1 1] |
| red | [1 0 0] |
| green | [0 1 0] |
| blue | [0 0 1] |
| white | [1 1 1] |
| black | [0 0 0] |
Alternatively, you can create the matrix by calling one of the predefined
colormap functions. Call the function as the input argument to the
rgbplot function. For example, this command plots
the parula
colormap.
rgbplot(parula)
Data Types: double | single
Version History
Introduced before R2006a
See Also
MATLAB Command
You clicked a link that corresponds to this MATLAB command:
Run the command by entering it in the MATLAB Command Window. Web browsers do not support MATLAB commands.
Select a Web Site
Choose a web site to get translated content where available and see local events and offers. Based on your location, we recommend that you select: .
You can also select a web site from the following list
How to Get Best Site Performance
Select the China site (in Chinese or English) for best site performance. Other MathWorks country sites are not optimized for visits from your location.
Americas
- América Latina (Español)
- Canada (English)
- United States (English)
Europe
- Belgium (English)
- Denmark (English)
- Deutschland (Deutsch)
- España (Español)
- Finland (English)
- France (Français)
- Ireland (English)
- Italia (Italiano)
- Luxembourg (English)
- Netherlands (English)
- Norway (English)
- Österreich (Deutsch)
- Portugal (English)
- Sweden (English)
- Switzerland
- United Kingdom (English)