Create an Interactive Narrative Using the Live Editor
The following is an example of how to create an interactive narrative in the Live Editor. An interactive narrative ties together the computations that you use to solve a problem. This example shows how to:
Display output together with your MATLAB® code.
Use formatted text to describe your approach.
Use equations to describe the underlying mathematics.
Use images to illustrate important points.
Add links to background material.
Use controls to modify parameters and re-run the analysis.
Plot data for visualization.
Invite colleagues to extend your analysis.
Overall Approach
Include formatted text as part of the interactive narrative. Use bold, italic, and underlined text to highlight important words. Use bullets or numbers to format lists.
Estimate the power output from a typical solar panel installation on a specific date, time, and location by calculating the following:
Solar time
Solar declination and solar elevation
Air mass and the solar radiation reaching the earth's surface
Radiation on a solar panel given its position, tilt, and efficiency
Power generated in a day and over the entire year
Use the results of these calculations to plot solar and panel radiation for the example day and location. Then, plot the expected panel power generation over the course of a year. To streamline the analysis, use two MATLAB functions created for this example: solarCorrection and panelRadiation.
Solar Time
Show output together with the code that produced it. To run a section of code, go to the Live Editor tab and click the Run Section button.
Power generation in a solar panel depends on how much solar radiation reaches the panel. This in turn depends on the sun's position relative to the panel as the sun moves across the sky. For example, suppose that you want to calculate power output for a solar panel on June 1st at 12 noon in Boston, Massachusetts.
lambda =-71.06; % longitude phi =
42.36; % latitude UTCoff =
'-5'; % UTC offset january1 = datetime(2019,1,1); % January 1st localTime = datetime(2019,6,1,12,0,0) % Noon on June 1
localTime = datetime
   01-Jun-2019 12:00:00
To calculate the sun's position for a given date and time, use solar time. Twelve noon solar time is the time when the sun is highest in the sky. To calculate solar time, apply a correction to local time. That correction has two parts:
A term which corrects for the difference between the observer's location and the local meridian.
An orbital term related to the earth's orbital eccentricity and axial tilt.
Calculate solar time using the solarCorrection function.
d = caldays(between(january1,localTime,'Day'));            % Day of year
solarCorr = solarCorrection(d,lambda,str2double(UTCoff));              % Correction to local time
solarTime = localTime + minutes(solarCorr)
solarTime = datetime
   01-Jun-2019 12:18:15
Solar Declination and Elevation
Include equations to describe the underlying mathematics. Create equations using LaTeX commands. To add a new equation, go to the Insert tab and click the Equation button. Double-click an equation to edit it in the Equation Editor.
The solar declination () is the angle of the sun relative to the earth's equatorial plane. The solar declination is at the vernal and autumnal equinoxes, and rises to a maximum of at the summer solstice. Calculate the solar declination for a given day of the year (d) using the equation
Then, use the declination (), the latitude (), and the hour angle () to calculate the sun's elevation () at the current time. The hour angle is the number of degrees of rotation of the earth between the current solar time and solar noon.
delta = asind(sind(23.45)*sind(360*(d - 81)/365));         % Declination
omega = 15*(solarTime.Hour + solarTime.Minute/60 - 12);    % Hour angle
alpha = asind(sind(delta)*sind(phi) + ...                  % Elevation
     cosd(delta)*cosd(phi)*cosd(omega));
disp(['Solar Declination = ' num2str(delta) '   Solar Elevation = ' num2str(alpha)])
Solar Declination = 21.8155 Solar Elevation = 69.113
Calculate the time of sunrise and sunset in Standard Time using the sun's declination and the local latitude.
midnight = dateshift(localTime,'start','day');
sr = 12 - acosd(-tand(phi)*tand(delta))/15 - solarCorr/60;
sunrise = timeofday(midnight + hours(sr));
ss = 12 + acosd(-tand(phi)*tand(delta))/15 - solarCorr/60;
sunset = timeofday(midnight + hours(ss));

sunrise.Format = 'hh:mm:ss';
sunset.Format = 'hh:mm:ss';
disp('Sunrise = ' + string(sunrise) + '   Sunset = ' + string(sunset))
Sunrise = 04:16:06 Sunset = 19:07:22
Air Mass and Solar Radiation
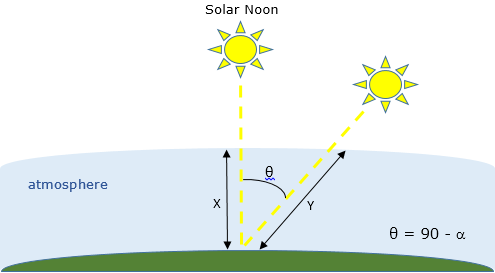
Include images to illustrate important points in your story. To include an image, copy and paste an image from another source or go to the Insert tab and click the Image button.
As light from the sun passes through the earth's atmosphere, some of the solar radiation is absorbed. Air mass is the length of the path of light through the atmosphere (Y) relative to the shortest possible path (X) when the sun's elevation is 90, as shown in the diagram below. It is a function of solar elevation ().

The larger the air mass, the less radiation reaches the ground. Calculate the air mass using the equation
Then, calculate the solar radiation reaching the ground (in kilowatts per square meter) using the empirical equation
airMass = 1/(cosd(90-alpha) + 0.50572*(6.07955+alpha)^-1.6354);
solarRad = 1.353*0.7^(airMass^0.678);                           % kW/m^2
disp(['Air Mass = ' num2str(airMass) '   Solar Radiation = ' num2str(solarRad) ' kW/m^2'])
Air Mass = 1.0698 Solar Radiation = 0.93141 kW/m^2
Solar Radiation on Fixed Panels
Use hyperlinks to reference supporting information from other sources. To add a hyperlink, go to the Insert tab and click the Hyperlink button.
Panels installed with a solar tracker can move with the sun and receive 100% of the sun's radiation as the sun moves across the sky. However, most solar cell installations have panels set at a fixed azimuth and tilt. Therefore, the actual radiation reaching the panel also depends on the solar azimuth. The solar azimuth () is the compass direction of the sun's position in the sky. At solar noon in the Northern hemisphere the solar azimuth is corresponding to the direction south. Calculate the solar azimuth using the equation
gamma = acosd((sind(delta)*cosd(phi) - cosd(delta)*sind(phi)*cosd(omega))/cosd(alpha));
if (hour(solarTime) >= 12) && (omega >= 0)
    gamma = 360 - gamma;
end
disp(['Solar Azimuth = ' num2str(gamma)])
Solar Azimuth = 191.7888
In the northern hemisphere, a typical solar panel installation has panels oriented toward the south with a panel azimuth () of . At northern latitudes, a typical tilt angle () is . Calculate the panel radiation for fixed panels from the total solar radiation using the equation
.
beta = 180;                                                % Panel azimuth
tau = 35;                                                  % Panel tilt
panelRad = solarRad*max(0,(cosd(alpha)*sind(tau)*cosd(beta-gamma) + sind(alpha)*cosd(tau)));
disp(['Panel Radiation = ' num2str(panelRad) ' kW/m^2'])
Panel Radiation = 0.89928 kW/m^2
Panel Radiation and Power Generation for a Single Day
Modify parameters using interactive controls. Display plots together with the code that produced them.
Panel Radiation
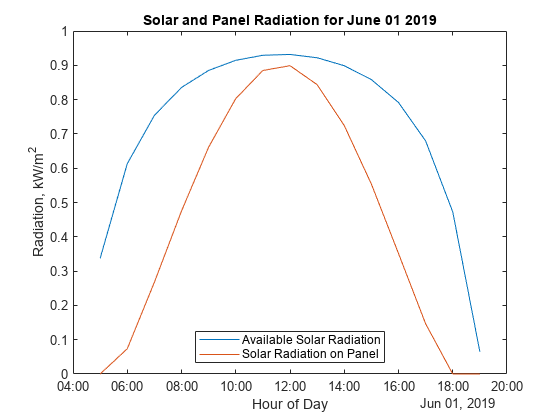
For a given day of the year, calculate the total solar radiation and the radiation on the panel. To simplify the analysis, use the panelRadiation function. Try different dates to see how the solar and panel radiation change depending on the time of year.
selectedMonth =6; selectedDay =
1; selectedDate = datetime(2019,selectedMonth,selectedDay); [times,solarRad,panelRad] = panelRadiation(selectedDate,lambda,phi,UTCoff,tau,beta) ; plot(times,solarRad,times,panelRad) selectedDate.Format = 'MMMM dd yyyy'; title('Solar and Panel Radiation for ' + string(selectedDate)) xlabel('Hour of Day'); ylabel('Radiation, kW/m^2') legend('Available Solar Radiation','Solar Radiation on Panel', 'Location','South')

Power Generation
So far, the calculations assume that all of the radiation reaching the panel is available to generate power. However, solar panels do not convert 100% of available solar radiation into electricity. The efficiency of a solar panel is the fraction of the available radiation that is converted. The efficiency of a solar panel depends on the design and materials of the cell.
Typically, a residential installation includes 20 of solar panels with an efficiency of 25%. Modify the parameters below to see how efficiency and size affect panel power generation.
eff =0.25; % Panel efficiency pSize =
20; % Panel size in m^2 radiation = sum(panelRad(1:end-1)+panelRad(2:end))/2; dayPower = eff*pSize*radiation; % Panel electric output in kW selectedDate.Format = 'dd-MMM-yyyy'; disp('Expected daily electical output for ' + string(selectedDate) + ' = ' + num2str(dayPower) + ' kW')
Expected daily electical output for 01-Jun-2019 = 33.4223 kW
Power Generation for the Whole Year
Hover over a plot to interact with it. Interacting with a plot in the Live Editor will generate code that you can then add to your script.
Repeat the calculation to estimate power generation for each day of the year.
yearDates = datetime(2019,1,1:365);                        % Create a vector of days in the year
dailyPower = zeros(1,365);
for i = 1:365
    [times,solarRad,panelRad] = panelRadiation(yearDates(i),lambda,phi,UTCoff,tau,beta) ;
    radiation = sum(panelRad(1:end-1)+panelRad(2:end))/2;
    dailyPower(i) = eff*pSize*radiation;
end

plot(yearDates,dailyPower)
title('Yearly Power Generation')
xlabel('Date');
ylabel('Power Generation, kW')

yearlyPower = sum(dailyPower);
disp(['Expected annual power output = ' num2str(yearlyPower) ' kW'])
Expected annual power output = 9954.3272 kW
Panel Tilt and Latitude
Use a heatmap to determine how panel tilt affects power generation. The heatmap below shows that the optimal panel tilt for any location is about less than the latitude.
load LatitudeVsTilt.mat
heatmap(powerTbl,'Tilt','Latitude',...
    'ColorVariable','Power');
xlabel('Panel Tilt')
ylabel('Latitude')
title('Normalized Power Output')

Extend the Analysis
Share your analysis with colleagues. Invite them to reproduce or extend your analysis. Work collaboratively using the Live Editor.
In reality, true power output from a solar installation is significantly affected by local weather conditions. An interesting extension of this analysis would be to see how cloud cover affects the results. In the US, you can use data from these government websites.
Use historical local weather data from the National Weather Service website.
Use measured solar radiation data from the National Solar Radiation Database.