Types of Bar Graphs
Bar graphs are useful for viewing results over a period of time, comparing results from different data sets, and showing how individual elements contribute to an aggregate amount.
By default, bar graphs represents each element in a vector or matrix as one bar, such that the bar height is proportional to the element value.
2-D Bar Graph
The bar function distributes bars along the x-axis. Elements in the same row of a matrix are grouped together. For example, if a matrix has five rows and three columns, then bar displays five groups of three bars along the x-axis. The first cluster of bars represents the elements in the first row of Y.
Y = [5,2,1
     8,7,3
     9,8,6
     5,5,5
     4,3,2];
figure
bar(Y)
To stack the elements in a row, specify the stacked option for the bar function.
figure
bar(Y,'stacked')
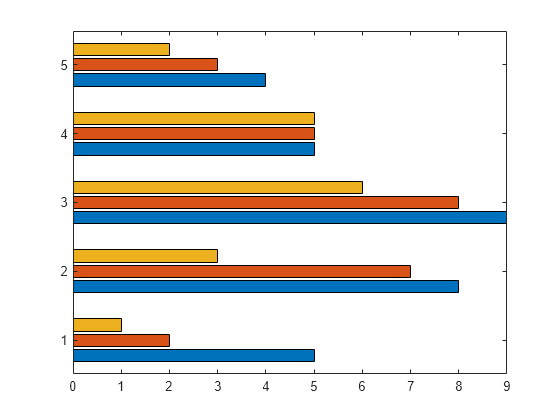
2-D Horizontal Bar Graph
The barh function distributes bars along the y-axis. Elements in the same row of a matrix are grouped together.
Y = [5,2,1
     8,7,3
     9,8,6
     5,5,5
     4,3,2];
figure
barh(Y)
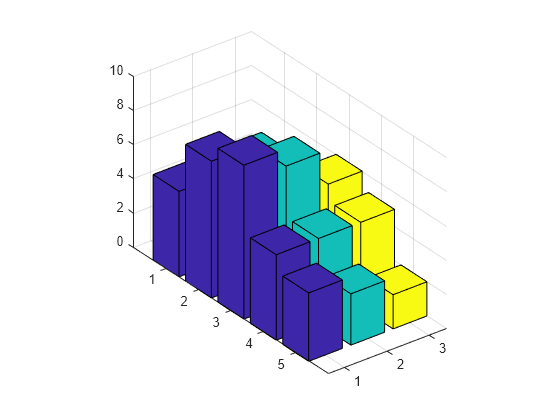
3-D Bar Graph
The bar3 function draws each element as a separate 3-D block and distributes the elements of each column along the y-axis.
Y = [5,2,1
     8,7,3
     9,8,6
     5,5,5
     4,3,2];
figure
bar3(Y)
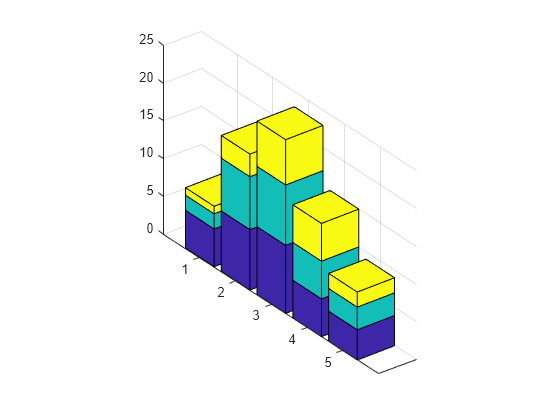
To stack the elements in a row, specify the stacked option for the bar3 function.
figure
bar3(Y,'stacked')
3-D Horizontal Bar Graph
The bar3h function draws each element as a separate 3-D block and distributes the elements of each column along the z-axis.
Y = [5,2,1
     8,7,3
     9,8,6
     5,5,5
     4,3,2];
figure
bar3h(Y)