Maximize Geographic Axes in Figure
Maximize the layout of a geographic axes by making the map fill the entire figure and by hiding the grid and tick marks.
This example assumes that the geographic axes is parented to a Figure object and uses the default values for the Units property, "normalized", and the OuterPosition property, [0 0 1 1]. Otherwise, the axes might not fill the figure and you might see the tick and axis labels.
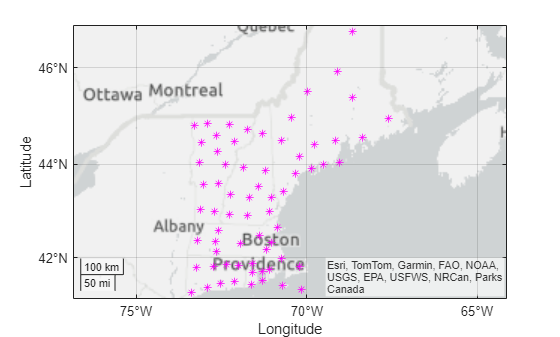
Create a map from the latitude and longitude coordinates stored in a table.
counties = readtable("counties.xlsx");
lat = counties.Latitude;
lon = counties.Longitude;
geoplot(lat,lon,"*m")
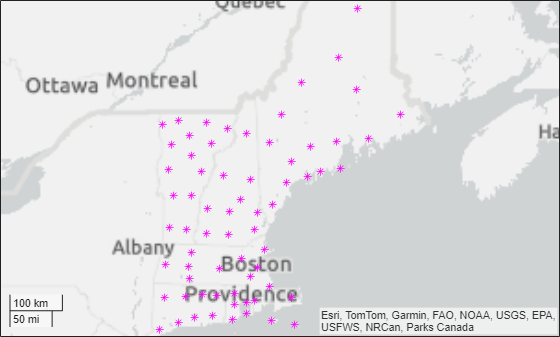
Maximize the geographic axes within the figure. For best results, the Units property of the geographic axes should be "normalized" and the OuterPosition property of the geographic axes should be [0 0 1 1]. Otherwise, decorations such as the tick and axis labels might still be visible.
Make the axes fill the entire figure by setting the
InnerPositionproperty of the axes object equal to theOuterPositionproperty.Remove the tick marks by changing the
TickDirproperty of the axes object.Turn off the grid by using the
gridfunction.
gx = gca;
gx.InnerPosition = gx.OuterPosition;
gx.TickDir = "none";
grid off