Visualize Spatial Error Using Tissot Indicatrices
A standard method of visualizing the distortions introduced by the map projection is to display small circles at regular intervals across the globe. After projection, the small circles appear as ellipses of various sizes, elongations, and orientations. The sizes and shapes of the ellipses reflect the projection distortions. Conformal projections have circular ellipses, while equal-area projections have ellipses of the same area. This method was invented by Nicolas Tissot in the 19th century, and the ellipses are called Tissot indicatrices in his honor. The measure is a tensor function of location that varies from place to place, and reflects the fact that, unless a map is conformal, map scale is different in every direction at a location.
Visualize Projection Distortions Using Tissot Indicatrices
This example shows how to add Tissot indicatrices to a map display.
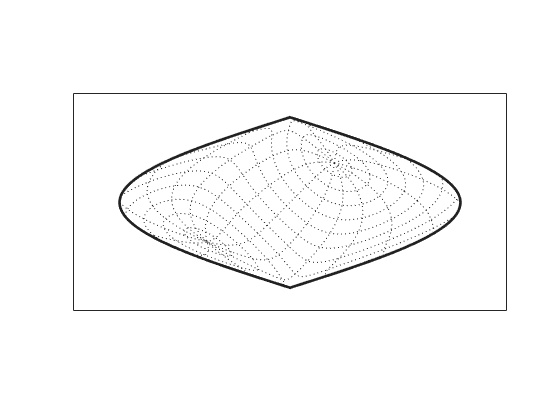
Set up a Sinusoidal projection in a skewed aspect, plotting the graticule.
figure
axesm sinusoid
gridm on
framem on
setm(gca,'Origin',[20 30 45])

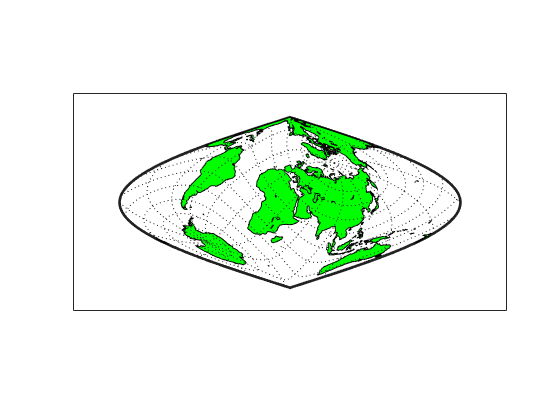
Load the coast data set and plot it as green patches.
load coastlines
patchm(coastlat,coastlon,'g')

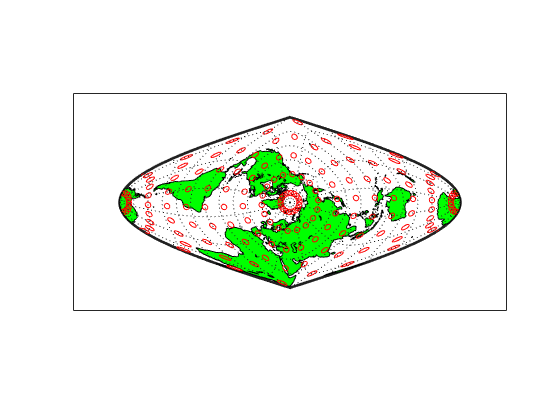
Plot the default Tissot diagram. Notice that the circles vary considerably in shape. This indicates that the Sinusoidal projection is not conformal. Despite the distortions, however the circles all cover equal amounts of area on the map because the projection has the equal-area property. Default Tissot diagrams are drawn with blue unfilled 100-point circles spaced 30 degrees apart in both directions. The default circle radius is 1/10 of the current radius of the reference ellipsoid (by default that radius is 1).
tissot

Clear the Tissot diagram, rotate the projection to a polar aspect, and plot a new Tissot diagram using circles paced 20 degrees apart, half as big as before, drawn with 20 points, and drawn in red. In the result, note that the circles are drawn faster because fewer points are computed for each one. Also note that the distortions are still smallest close to the map origin, and still greatest near the map frame.
clmo tissot
setm(gca,'Origin',[90 0 45])
tissot([20 20 .05 20],'Color','r')

See Also
distortcalc | mdistort | tissot