Compare Polygons and Line Segments
Geographic objects represented by vector data might or might not be formatted as
polygons. Imagine two variables, latcoast and
loncoast, that correspond to a sequence of points that caricature
the coast of the island of Great Britain. If this data returns to its starting point,
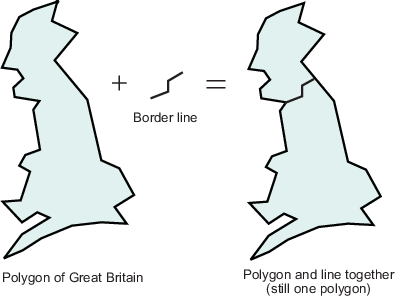
then a polygon describing Great Britain exists. This data might be plotted as a patch or
as a line, and it might be logically employed in calculations as either.
Now suppose that you want to represent the Anglo-Scottish border, proceeding from the
west coast at Solway Firth to the east coast at Berwick-upon-Tweed. This data can only
be properly defined as a line, defined by two or more points, which you can represent
with two more variables, latborder and lonborder.
When plotted together, the two pairs of variables can form a map. The patch of Great
Britain plus the line showing the Scottish border might look like two patches or
regions, but there is no object that represents England and no object that represents
Scotland, either in the workspace or on the map.
In order to represent both regions properly, the Great Britain polygon needs to be
split at the two points where the border meets it, and a copy of
latborder and lonborder concatenated to both
lines (placing one in reverse order). The resulting two polygons can be represented
separately (e.g., in four variables named latengland,
lonengland, latscotland, and
lonscotland) or in two variables that define two polygons each,
delineated by NaNs (e.g., latuk, lonuk).
The distinction between line and polygon data might not appear to be important, but it
can make a difference when you are performing geographic analysis and thematic mapping.
For example, polygon data can be treated as line data and displayed with functions such
as linem, but line data cannot be handled as polygons unless it is
restructured to make all objects close on themselves.