Main Content

impixelregion

Pixel Region tool

Description

Use the impixelregion function to create a Pixel Region tool and explore the pixel values of images interactively.
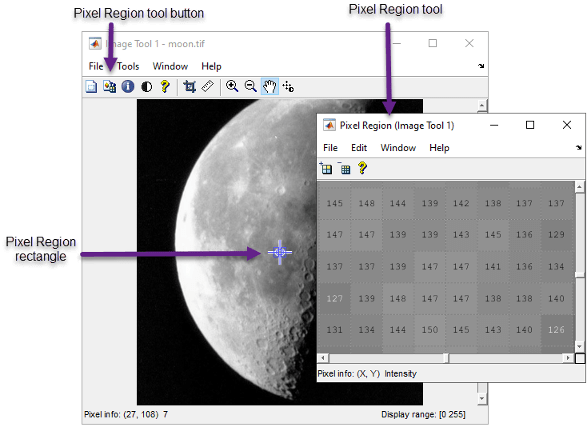
The Pixel Region tool displays an extreme close-up view of a small region of pixels in the target image. The tool overlays a rectangle, called the pixel region rectangle, over the target image. To view pixels in a different region, click and drag the rectangle over the target image, or scroll the Pixel Region tool. You can resize the pixel region rectangle to change the resolution of pixels in the Pixel Region tool. If the size of the pixels allows, the tool superimposes the numeric value of the pixel over each pixel.

Pixel Region tool displays the numeric pixel value over each pixel in a magnified region. A corresponding rectangle encloses the same region of pixels in the original image figure.

impixelregion creates a Pixel Region tool associated with the image displayed in the current figure.

example

impixelregion(h) creates a Pixel Region tool associated with the image in the graphics container h.

hTool = impixelregion(___) returns the figure hTool containing the Pixel Region tool.

Examples

collapse all

Display an image.

imshow('peppers.png')

Create an pixel region tool in a new figure window. The tool associates with the image in the current figure.

impixelregion

Figure contains an axes object. The hidden axes object contains 12 objects of type line, patch, image.

Figure Pixel Region (Figure 1) contains an axes object and other objects of type uipanel, uitoolbar, uimenu. The hidden axes object contains 53 objects of type line, image, text.

Input Arguments

collapse all

Graphics object containing the image, specified as a Figure, Panel, Axes, or Image object. If h is an axes or figure, then impixelregion uses the first image returned by findobj(h,Type="image").

Output Arguments

collapse all

Pixel Region tool, returned as a Figure object.

Tips

  • To get a closer view of the pixels displayed in the tool, use the zoom buttons on the Pixel Region tool toolbar.

  • To get the current position of the pixel region rectangle, right-click on the rectangle and select Copy Position from the context menu. The Pixel Region tool copies a four-element position vector to the clipboard.

    Pixel Region tool, showing the location of the Copy Position option in the Edit menu and the Pixel Info display at the bottom left corner of the window

  • To change the color of the pixel region rectangle, right-click and select Set Color.

  • To create a Pixel Region tool that can be embedded in an existing figure or panel, use impixelregionpanel.

Version History

Introduced before R2006a

Go to top of page