hough
Hough transform
Description
[ calculates the Standard Hough Transform (SHT) of the
binary image H,theta,rho]
= hough(BW)BW. You can use the Hough
transform matrix H to detect lines.
The function uses the parametric representation of a line: rho =
x*cos(theta)
+
y*sin(theta). Here, rho is the offset from
the origin to a line along a vector perpendicular to the line, and
theta is the angles in degrees between
the x-axis and the vector perpendicular to the
line. The function samples the SHT for many combinations of
rho and theta values,
and returns the sampled values in rho and
theta, respectively. For more
information, see Hough Transform.
Examples
Read and display an image.
RGB = imread("gantrycrane.png");
imageshow(RGB)![]()
Convert the image to grayscale, then find the edges in the image.
I  = im2gray(RGB);
BW = edge(I,"canny");
Calculate the Hough transform.
[H,T,R] = hough(BW,RhoResolution=0.5,Theta=-90:0.5:89);
The Hough matrix is of data type double with values outside the range [0, 1]. To display the Hough matrix, rescale the data to the range [0, 1]. Improve the image contrast for display by using the imadjust function.
Hdisp = rescale(H);
Hdisp = imadjust(Hdisp);

imshow(Hdisp,XData=T,YData=R)
xlabel("\theta")
ylabel("\rho")
axis on
axis normal
hold on
colormap(gca,hot)
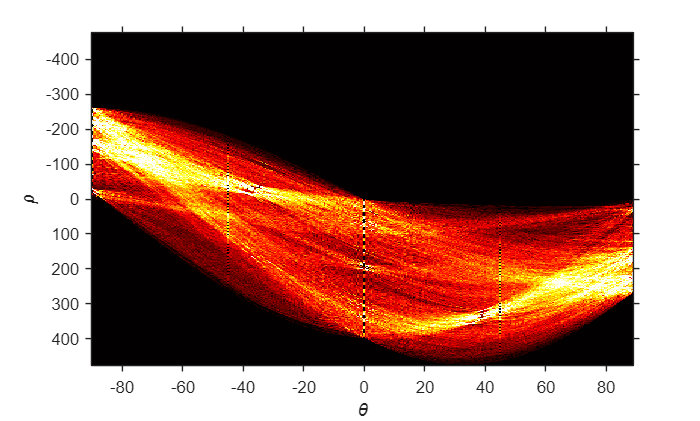
Read an image.
RGB = imread("gantrycrane.png");Convert the image to grayscale, then find the edges in the image.
I  = im2gray(RGB);
BW = edge(I,'canny');
Calculate the Hough transform over a limited range of angles.
[H,T,R] = hough(BW,Theta=44:0.5:46);
The Hough matrix is of data type double with values outside the range [0, 1]. To display the Hough matrix, rescale the data to the range [0, 1]. Improve the image contrast for display by using the imadjust function.
Hdisp = rescale(H);
Hdisp = imadjust(Hdisp);
imshow(Hdisp,XData=T,YData=R)
xlabel("\theta")
ylabel("\rho")
axis on
axis normal
hold on
colormap(gca,hot)

Input Arguments
Name-Value Arguments
Output Arguments
Algorithms
The Standard Hough Transform (SHT) uses the parametric representation of a line:
rho =
x*cos(theta)
+
y*sin(theta)
The origin of the coordinate system is assumed to be at the center of the upper-left corner pixel.
The variable theta is the angle of the perpendicular projection from the origin to the line, measured in degrees clockwise from the positive x-axis. The range of theta is –90° ≤ theta < 90°. The angle of the line itself is theta + 90°, also measured clockwise with respect to the positive x-axis.
The variable rho is the perpendicular offset from the
origin to the line. The magnitude of rho is equivalent to
the perpendicular distance between the origin and the line. However, the
hough function supports negative values of
rho to represent lines with an effective rotation
angle outside the supported range of theta. Graphically,
rho is negative when the line passes through the
quadrant opposite to the normal vector defined by theta.
In other words, rho is negative to represent lines for
which the effective rotation angle would be –180° ≤ theta < –90° or 90° ≤ theta < 180°.

The Hough transform matrix, H, is a parameter space matrix whose rows and
columns correspond to rho and theta
values, respectively. For every combination of rho and
theta, the SHT calculates the line with those
parameters and returns the sum of all true pixels in
BW along that line. When many pixels have a
true value along a parameterized line, the result
is a peak value in the Hough transform matrix. Peak values represent
potential lines in the input image. You can find peak values in the Hough
transform matrix by using the houghpeaks
function.
Because the origin is at the center of the upper-left corner pixel, there are
no lines in the image for which rho is negative and
theta is positive. Elements of the Hough
transform matrix that correspond to negative rho and
positive theta have the value
0.