Process Large Set of Images Using MapReduce Framework and Hadoop
This example shows how to execute a cell counting algorithm on a large number of images using Image Processing Toolbox™ with MATLAB® MapReduce and datastores. MapReduce is a programming technique for analyzing data sets that do not fit in memory. The example also uses MATLAB Parallel Server™ to run parallel MapReduce programs on Hadoop® clusters. The example shows how to test your algorithm on a local system on a subset of the images before moving it to the Hadoop cluster.
Download Sample Data
Download the BBBC005v1 data set from the Broad Bioimage Benchmark Collection. This data set is an annotated biological image set designed for testing and validation. The image set provides examples of in- and out-of-focus synthetic images, which can be used for validation of focus metrics. The data set contains almost 20,000 files. For more information, see this introduction to the data set.
At the system prompt on a Linux® system, use the wget command to download the zip file containing the BBBC data set. Before running this command, make sure that your target location has enough space to hold the zip file (1.8 GB) and the extracted images (2.6 GB).
wget https://data.broadinstitute.org/bbbc/BBBC005/BBBC005_v1_images.zip
At the system prompt on a Linux system, extract the files from the zip file.
unzip BBBC005_v1_images.zip
Examine the image file names in this data set. The names are constructed in a specific format to contain useful information about each image. For example, the file name BBBC005_v1_images/SIMCEPImages_A05_C18_F1_s16_w1.TIF indicates that the image contains 18 cells (C18) and was filtered with a Gaussian low-pass filter with diameter 1 and a sigma of 0.25x diameter to simulate focus blur (F1). The w1 identifies the stain used. For example, find the number of images in the data set that use the w1 stain.
d = dir('C:\Temp\BBBCdata\BBBC005_v1_images\*w1*');
numel(d)
ans = 9600
Test Algorithm on Sample Image
View the files in the BBBC data set and test an algorithm on a small subset of the files using the Image Batch Processor app. The example tests a simple algorithm that segments the cells in the images. (The example uses a modified version of this cell segmentation algorithm to create the cell counting algorithm used in the MapReduce implementation.)
Load Image Files into the Image Batch Processor
Open the Image Batch Processor app. From the MATLAB toolstrip, on the Apps tab, in the Image Processing and Computer Vision section, click Image Batch Processor. You can also open the app from the command line using the imageBatchProcessor command.
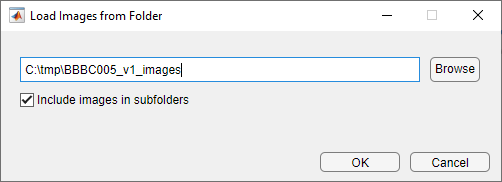
In the Image Batch Processor app, click Import Images and navigate to the folder in which you stored the downloaded data set.
The Image Batch Processor app displays thumbnails of the images in the folder in the left pane and a higher-resolution version of the currently selected image in the Input Image tab. View some of the images to get familiar with the data set.

Specify Segmentation Function
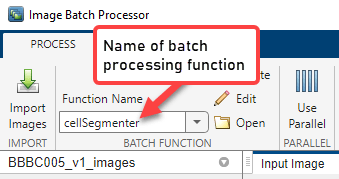
Specify the name of the function that implements your cell segmentation algorithm. To specify an existing function, type its name in the Function name field or click the folder icon to browse and select the function. To create a new batch processing function, click Create. The app opens the batch function template in the MATLAB® editor. For this example, create a new function containing the following image segmentation code. Click Save to create the batch function. The app updates to display the name of the function you created in the Batch Function section of the app toolstrip.
function imout = cellSegmenter(im)  % A simple cell segmenter
    % Otsu thresholding
    bw = imbinarize(im);

    % Show thresholding result in app
    imout = imfuse(im,bw);

    % Find area of blobs
    stats = regionprops('table',bw,{'Area'});

    % Average cell diameter is about 33 pixels (based on random inspection)
    cellArea = pi*(33/2)^2;

    % Estimate cell count based on area of blobs
    cellsPerBlob = stats.Area/cellArea;
    cellCount = sum(round(cellsPerBlob));
    disp(cellCount);
end
Test Your Segmentation Function on Sample Image
Select the thumbnail of an image displayed in the app and click Process Selected to execute a test run of your algorithm. For this example, choose only an image with the “w1” stain (identifiable in the file name). The segmentation algorithm works best with these images.
Examine the results of running your algorithm to verify that your segmentation algorithm found the correct number of cells in the image. The names of the images contain the cell count in the C number. For example, the image named SIMCEPImages_A05_C18_F1_s05_w1.TIF contains 18 cells. Compare this number to the results returned at the command line for the sample image.
Test Algorithm on MapReduce Framework Locally
After assuring that your segmentation code works as expected on one image, set up a small test version on your local system of the large scale processing you want to perform. You should test your processing framework before running it on thousands of files.
Load Image Files into Image Datastore
First, create an image datastore, using the imageDatastore function, containing a small subset of your images. MapReduce uses a datastore to process data in small chunks that individually fit into memory. Move to the folder containing the images and create an image datastore. Because the cell segmentation algorithm implemented in cellSegmenter.m works best with the cell body stain, select only the files with the indicator w1 in their file names.
localimds = imageDatastore(fullfile('/your_data/broad_data/BBBC005_v1-images','*w1*'));
Even limiting the selection to file with "w1" in their names, the image data store still contains over 9000 files. Subset the list of images further, selecting every 100th file from the thousands of files in the data set.
localimds.Files = localimds.Files(1:100:end);
Repackage the Sample Set into an Hadoop Sequence File
Once you have created the image datastore, convert the sample subset of images into Hadoop sequence files, a format used by the Hadoop cluster. Note that this step simply changes the data from one storage format to another without changing the data value. For more information about sequence files, see Getting Started with MapReduce.
To convert the image datastore to an Hadoop sequence file, create a “map” function and a “reduce” function which you pass to the mapreduce function. To convert the image files to Hadoop sequence files, the map function should be a no-op function. For this example, the map function simply saves the image data as-is, using its file name as a key.
function identityMap(data, info, intermKVStore)
     add(intermKVStore, info.Filename, data);
end
Create a reduce function that converts the image files into a key-value datastore backed by sequence files.
function identityReduce(key, intermValueIter, outKVStore)
    while hasnext(intermValueIter)
        add(outKVStore, key, getnext(intermValueIter));
    end
end
Call mapreduce, passing your map and reduce functions. The example first calls the mapreducer function to specify where the processing takes place. To test your set up and perform the processing on your local system, specify 0.
mapreducer(0);
When run locally, mapreduce creates a key-value datastore backed by MAT files.
localmatds = mapreduce(localimds,@identityMap,@identityReduce,'OutputFolder',pwd);
Test MapReduce Framework Locally
After creating the subset of image files for testing, and converting them to a key-value datastore, you are ready to test the algorithm. Modify your original cell segmentation algorithm to return the cell count. (The Image Batch Processor app, where this example first tested the algorithm, can only return processed images, not values such as the cell count.)
Modify the cell segmentation function to return a cell count and remove the display of the image.
function cellCount = cellCounter(im)
    % Otsu thresholding
    bw = imbinarize(im);

    % Find area of blobs
    stats = regionprops('table',bw,{'Area'});

    % Average cell diameter is about 33 pixels (based on random inspection)
    cellArea = pi*(33/2)^2;

    % Estimate cell count based on area of blobs
    cellsPerBlob = stats.Area/cellArea;
    cellCount = sum(round(cellsPerBlob));
end
Create a map function that calculates the error count for a specific image. This function gets the actual cell count for an image from the file name coding (the C number) and compares it to the cell count returned by the segmentation algorithm.
function mapImageToMisCountError(data, ~, intermKVStore)
    % Extract the image
    im = data.Value{1};
    % Call the cell counting algorithm
    actCount = cellCounter(im);
    % The original file name is available as the key
    fileName = data.Key{1};
    [~, name] = fileparts(fileName);
    % Extract expected cell count and focus blur from the file name
    strs = strsplit(name, '_');
    expCount  = str2double(strs{3}(2:end));
    focusBlur = str2double(strs{4}(2:end));
    diffCount = abs(actCount-expCount);
    % Note: focus blur is the key
    add(intermKVStore, focusBlur, diffCount);
end
Create a reduce function that computes the average error in cell count for each focus value.
function reduceErrorCount(key, intermValueIter, outKVStore)
    focusBlur = key;
    % Compute the sum of all differences in cell count for this value of
    % focus blur
    count = 0;
    totalDiff = 0;
    while hasnext(intermValueIter)
        diffCount = getnext(intermvalueIter);
        count = count + 1;
        totalDiff = totalDiff+diffCount;
    end
    % Average
    meanDiff = totalDiff/count;
    add(outKVStore, focusBlue, meanDiff);
end
Run the mapreduce job on your local system.
focusErrords = mapreduce(localmatds,@mapImageToMisCountError,@reduceErrorCount);
Gather the results.
focusErrorTbl = readall(focusErrords);
Get the average error values.
averageErrors = cell2mat(focusErrorTbl.Value);
The simple cell counting algorithm used here relies on the average area of a cell or a group of cells. Increasing focus blur diffuses cell boundaries, and thus the area. The expected result is for the error to go up with increasing focus blur, as seen in this plot of the results.
function plot_errors()
bar(focusErrorTbl.Key, averageErrors);
ha = gca;
ha.XTick = sort(focusErrorTbl.Key);
ha.XLim  = [min(focusErrorTbl.Key)-2 max(focusErrorTbl.Key)+2];
title('Cell counting result on a test data set');
xlabel('Focus blur');
ylabel('Average error in cell count');
end

Run MapReduce Framework on Hadoop Cluster
Now that you've verified the processing of your algorithm on a subset of your data, run your algorithm on the full dataset on a Hadoop cluster.
Load Data into the Hadoop File System
Load all the image data into the Hadoop file system and run your MapReduce framework on a Hadoop cluster, using the following shell commands. To run this command, replace your_data with the location on your computer.
hadoop fs -mkdir /user/broad_data/
hadoop fs -copyFromLocal /your_data/broad_data/BBBC005_v1_images /user/broad_data/BBBC005_v1_images
Set Up Access to MATLAB Parallel Server Cluster
Set up access to the MATLAB Parallel Server cluster. To run this command, replace 'your/hadoop/install' with the location on your computer.
setenv('HADOOP_HOME','/your/hadoop/install');
cluster = parallel.cluster.Hadoop;
cluster.HadoopProperties('mapred.job.tracker') = 'hadoop01glnxa64:54311';
cluster.HadoopProperties('fs.default.name') = 'hdfs://hadoop01glnxa64:54310';
disp(cluster);
Change Mapreduce Execution Environment to Remote Cluster
Change the mapreduce execution environment to point to the remote cluster.
mapreducer(cluster);
Convert All Image Data into Hadoop Sequence Files
Convert all the image data into Hadoop sequence files. This is similar to what you did on your local system when you converted a subset of the images for prototyping. You can reuse the map and reduce functions you used previously. Use the internal Hadoop cluster.
broadFolder = 'hdfs://hadoop01glnxa64:54310/user/broad_data/BBBC005_v1_images';
Pick only the cell body stain (w1) files for processing.
w1Files = fullfile(broadFolder,'*w1*.TIF');
Create an ImageDatastore representing all these files
imageDS = imageDatastore(w1Files);
Specify the output folder.
seqFolder = 'hdfs://hadoop01glnxa64:54310/user/datasets/images/broad_data/broad_sequence';
Convert the images to a key-value datastore.
seqds = mapreduce(imageDS,@identityMap,@identityReduce,'OutputFolder',seqFolder);
Run Cell Counting Algorithm on Entire Data Set
Run the cell counting algorithm on the entire data set stored in the Hadoop file system using the MapReduce framework. The only change from running the framework on your local system is that now the input and output locations are on the Hadoop file system.
First, specify the output location for error count.
output = 'hdfs://hadoop01glnxa64:54310/user/broad_data/BBBC005_focus_vs_errorCount';
Run your algorithm on the Mapreduce framework. Use the tic and toc functions to record how long it takes to process the set of images.
tic
focusErrords = mapreduce(seqds,@mapImageToMisCountError,@reduceErrorCount,'OutputFolder',output);
toc
Gather results.
focusErrorTbl = readall(focusErrords);
averageErrors = cell2mat(focusErrorTbl.Value);
Plot the results, as before.
function reduceErrorCountAll(key, intermValueIter, outKVStore)
    bar(focusErrorTbl.Key, averageErrors);
    ha = gca;
    ha.XTick = sort(focusErrorTbl.Key);
    ha.XLim  = [min(focusErrorTbl.Key)-2 max(focusErrorTbl.Key)+2];
    title('Cell counting result on the entire data set');
    xlabel('Focus blur');
    ylabel('Average error in cell count');
end
