Execution Profiler
Profile execution time of functions using either DWT Timer, GPIO or Timer measurement modes
Since R2025a
Description
The Execution Profile block enables you to profile the execution time of functions using either Data Watchpoint Trace (DWT) Timer, GPIO, or Timer measurement modes.
DWT Timer: Measure timing of tasks by recording the cycle count at the start and end of a function.
GPIO: Set and clear GPIO pins before and after the execution of downstream function-call subsystems.
Timer: Measure execution time of events by calculating the duration between pre-execution and post-execution timer counts.
These techniques enable you to accurately profile and optimize the performance of your code running on STM32 processors.
Examples
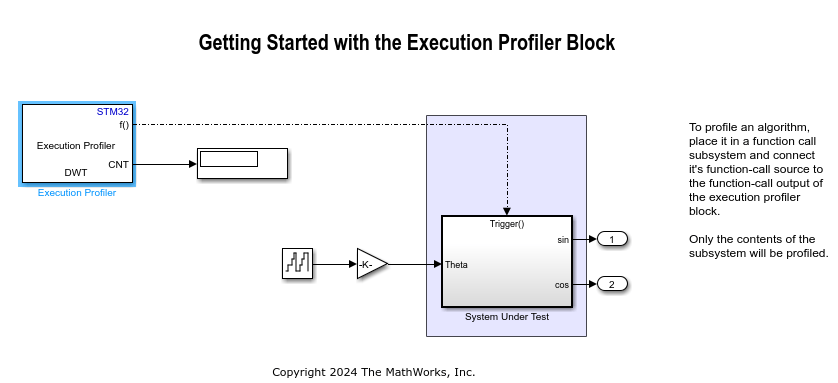
Profile STM32 Algorithms in Real-Time
Use the Execution Profiler block to perform real-time execution profiling of algorithms with the Embedded Coder® Support Package for STMicroelectronics® STM32 Processors. The example demonstrates three profiling methods:
Ports
Output
Parameters
Version History
Introduced in R2025a