Peak Finder Measurements
Note
Peak Finder measurements require a DSP System Toolbox™ or Simscape™ license.
The Peaks panel displays the maxima, showing the x-axis values at which they occur. Peaks are defined as a local maximum where lower values are present on both sides of a peak. Endpoints are not considered peaks. This panel allows you to modify the settings for peak threshold, maximum number of peaks, and peak excursion.
To enable and open the Peaks panel, click the Peak
Finder button (![]() ) in the Measurements tab of the
scope toolstrip.
) in the Measurements tab of the
scope toolstrip.
The peak finder settings enable you to modify the parameters used to calculate the peak values within the displayed portion of the input signal.
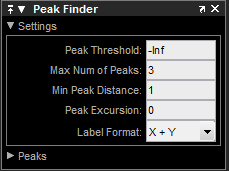
Label Peaks — Show labels (P1, P2, …) above the arrows on the plot.
Num Peaks — The maximum number of peaks to show. Specify a scalar integer from 1 through 99.
This setting is equivalent to the
NPeaksparameter, which you can set when you run thefindpeaksfunction.Min Height — The peak excursion or Min Height is the minimum height difference between a peak and its neighboring samples.
Min Distance — The minimum number of samples between adjacent peaks.
The algorithm chooses the tallest peak in the signal and ignores all peaks within the number of samples specified in Min Distance. The function then repeats the procedure for the tallest remaining peak and iterates until it runs out of peaks to consider.
This setting is equivalent to the
MinPeakDistanceparameter, which you can set when you run thefindpeaksfunction.Threshold — The level above which peaks are detected. Specifying the threshold can reduce the processing time.
This setting is equivalent to the
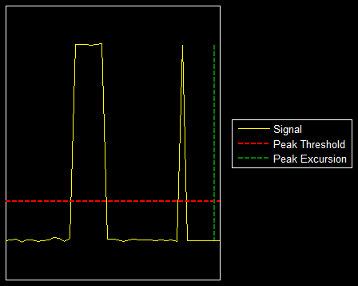
MinPeakHeightparameter, which you can set when you run thefindpeaksfunction.Peak excursion is illustrated alongside peak threshold in the following figure. The peak threshold is a minimum value necessary for a sample value to be a peak. The peak excursion or Min Height is the minimum difference between a peak sample and the samples to its left and right in the time domain. In the figure, the green vertical line represents the lesser of the two height differences between the labeled peak and its neighboring samples. This height difference must be greater than the Min Height value for the labeled peak to be classified as a peak. Compare this setting to peak threshold, represented by the red horizontal line. The amplitude must be above this horizontal line for the labeled peak to be classified as a peak.
The peak excursion setting is equivalent to the
Threshold parameter, which you can set when you run the
findpeaks function.
The Peaks panel displays the largest calculated peak values. It also shows the time at which the peaks occur. You set the Num Peaks parameter to specify the number of peaks shown in the list.
The numerical values displayed in the Value row
are equivalent to the pks output argument returned when you run the
findpeaks function. The numerical values displayed in the
Time (s) row are similar to the locs output
argument returned when you run the findpeaks function.
The Peaks are valid for any units of the input signal. The letter after the value associated with each measurement indicates the abbreviation for the appropriate International System of Units (SI) prefix, such as m for milli-. For example, if the input signal is measured in volts, an m next to a measurement value indicates that this value is in units of millivolts.