Main Content

Frequency Feature Extractor

Extract frequency-domain features from signal

Since R2026a

  • Icon for Frequency Feature Extractor block

Libraries:
DSP System Toolbox / Feature Extractors

Description

The Frequency Feature Extractor block extracts the frequency-domain features from the power spectral density (PSD) estimate of the input signal. The block uses the Welch's method of averaged modified periodograms to estimate the power spectral density. For more information, see Algorithms.

You can extract these frequency-domain features from the PSD data.

  • Mean frequency

  • Median frequency

  • Band power

  • Occupied bandwidth

  • Power bandwidth

  • Welch PSD

  • Peak amplitude

  • Peak location

For more information on these features, see the parameters section.

Examples

expand all

Extract the mean frequency and power bandwidth features from a multichannel whale signal.

Open the extractFrequencyFeaturesWhaleSounds.slx model. The two-channel input signal x comes from a preloaded data set labelwhalesignals that includes two recordings of blue whale songs that contain trills and moans. For more information about the whale songs data set, see Label Signal Attributes, Regions of Interest, and Points.

The signal x is trimmed from the songs whale1 and whale2 in the moan region, which are sampled at 4 kHz.

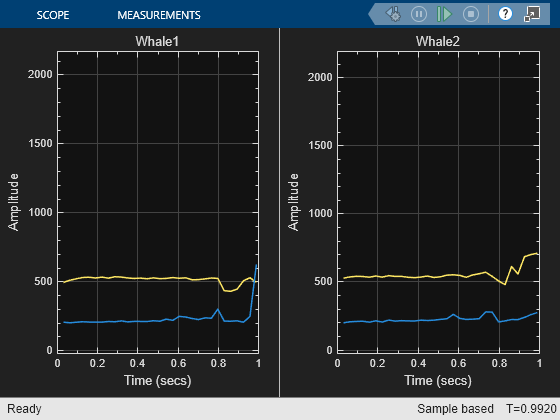
Here is the MATLAB® code to plot the input signal x.

   load labelwhalesignals
   x = [whale1(24701:28200) whale2(28201:31700)];
   t = 1/Fs*([(24701:28200)' (28201:31700)']-1);
   plot(t,x)
   legend(["whale1" "whale2"])

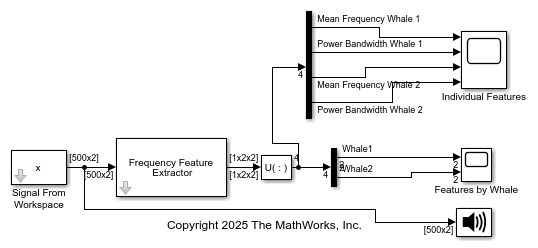
Extract the mean frequency and power bandwidth features of the input signal x. In the Frequency Feature Extractor block, set the Window length parameter to 128 and Overlap length to 0. Select Mean frequency and Power bandwidth to extract these features. The Frequency Feature Extractor block now models a feature extraction pipeline to output the frequency-domain features from the input signal.

Display the extracted features using Scope blocks. The Features by Whale scope shows the features for each whale in a separate display. The Individual Features scope shows each feature for each whale in a separate display. Use the Demux block to separate the extracted features and connect the outputs to the Scope blocks.

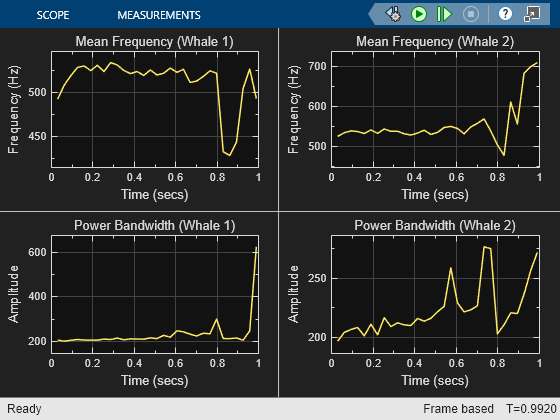
Run the model and visualize the mean frequency and power bandwidth features for whale1 and whale2 moans.

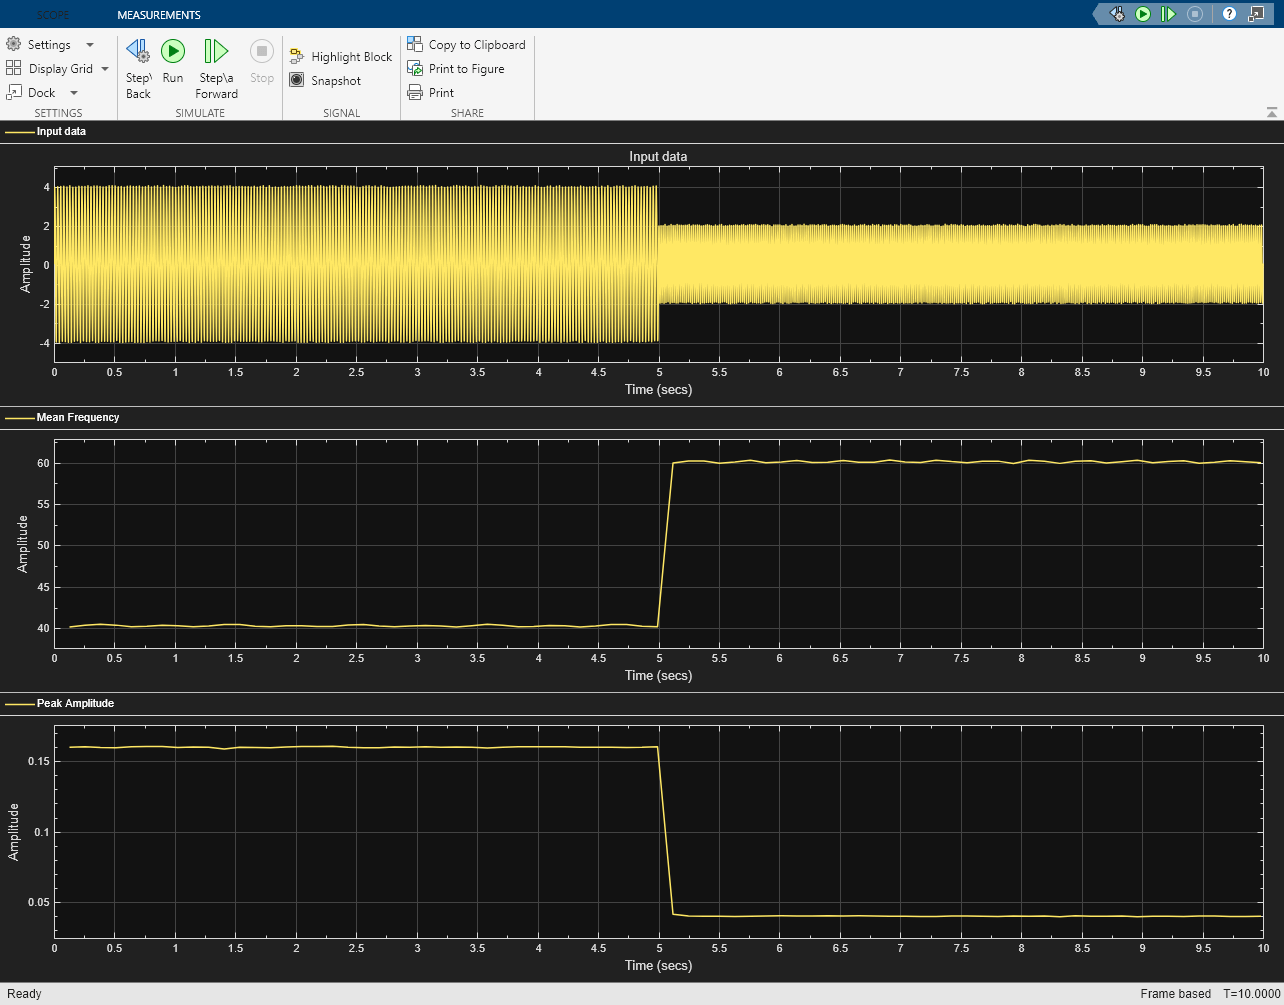
Extract the mean frequency and peak amplitude of a sinusoidal signal using the Frequency Feature Extractor block.

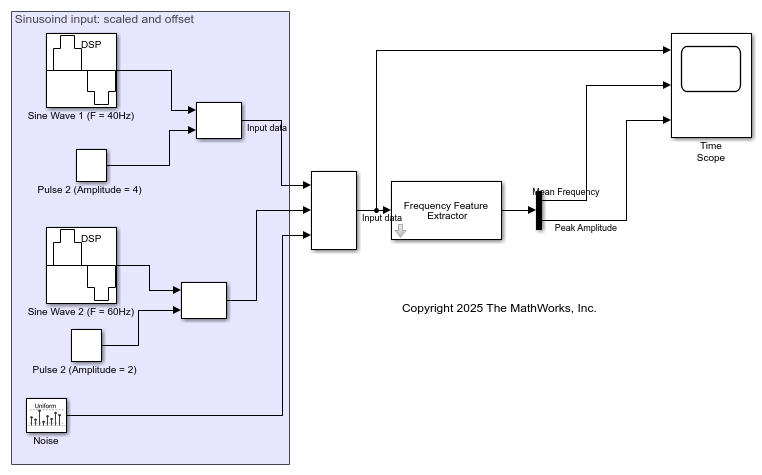
Open the extractFrequencyFeaturesSinuoid.slx model. The input is a sum of two sinusoidal signals each with their respective time-variant scale and offset values. The input can be expressed as x(t) = A*sin(2*pi*f*t + p) + B, where f = 40 and f = 60, p = 0, A is the scale determined by the pulse amplitude, and B is the offset determined by the Random Source block.

Extract the mean frequency and peak amplitude of the input signal. In the Frequency Feature Extractor block, set the Window length parameter to 128 and Overlap length to 0. Select Mean frequency and Peak amplitude to extract these features. The Frequency Feature Extractor block now models a feature extraction pipeline to output these features from the input signal.

Display the input signal and the extracted features in a Scope block. Use a Demux block to separate the extracted features and connect the outputs to the Scope block.

Run the model and visualize the input signal with time-variant scales and offsets, the mean frequency, and the peak amplitude features.

Ports

Input

expand all

Specify the input signal as a vector or a matrix of size m-by-q, where m is the frame size and q is the number of channels. The block estimates the PSD (power spectral density) of this signal using the welch PSD method and extracts the frequency-domain features from the PSD estimate.

To support complex inputs, set Spectrum type to two-sided in the Extractor parameters for Welch PSD.

Data Types: single | double
Complex Number Support: Yes

Output

expand all

Extracted features, returned as a vector or a 3-D array.

  • For a single-channel input signal specified as a vector with m elements, the block returns the extracted features as a 1-by-r vector.

  • For an q-channel input signal specified as a matrix of size m-by-q, the block returns the extracted features as a 1-by-r-by-q array.

Each feature extracted from the input signal appears in one or more columns of the output. For more information, see the Feature to output mapping parameter.

Dependencies

To enable this port, select at least one feature to map.

Data Types: single | double
Complex Number Support: Yes

Parameters

expand all

To edit block parameters interactively, use the Property Inspector. From the Simulink® Toolstrip, on the Simulation tab, in the Prepare gallery, select Property Inspector.

Signal Buffering

Specify the number of samples per frame WL to extract features from the input as a positive integer. The block divides the input signal into frames of the specified length and extracts features for each frame.

Specify the buffering method as one of these:

  • Overlap length — Number of overlapping samples between consecutive frames. Specify the overlap length in the Overlap length parameter.

  • Hop size — Number of samples between the start of frames. Specify the hop size HS in the Hop size parameter. The overlap length equals WLHS, where WL is the number of samples per frame that you specify in the Window length parameter.

    When there is no overlap between input frames, that is, overlap length is zero, select Hop size and set the Hop size parameter to the value of the Window length parameter.

Specify the number of overlapping samples between consecutive frames as a nonnegative integer. The blocks splits the input data into overlapping frames. This parameter specifies the amount of overlap between each frame. The overlap length must be less than the window length that you specify in the Window length parameter.

Dependencies

To enable this parameter, set Specify to Overlap length.

Specify the number of samples between the start of each frame as a positive integer. The hop size must be greater than the window length (input frame size) to support non-overlapping frames.

Dependencies

To enable this parameter, set Specify to Hop size.

Specify the source of the sample rate of the input signal Fs as one of these:

  • Inherit from input port — Select this option to inherit the sample rate from the input signal.

  • Positive scalar — Specify the sample rate directly in the block dialog box.

Features to Extract

Extract signal features in the frequency domain from the frequency-domain representation of the signal.

Select this parameter to extract the mean frequency of the input power spectrum in absolute units. For more information, see meanfreq.

If you select this parameter, the feature-extractor block enables this feature for extraction, extracts this feature, and concatenates it with all the other features that you enable in the block.

Select this parameter to extract the median frequency of the input power spectrum in absolute units. For more information about the median frequency feature, see medfreq.

If you select this parameter, the feature-extractor block enables this feature for extraction, extracts this feature, and concatenates it with all the other features that you enable in the block.

Select this parameter to extract the average power of the input signal.

Band power is the average power of the input signal. For more information about the band power feature, see bandpower.

If you select this parameter, the feature-extractor block enables this feature for extraction, extracts this feature, and concatenates it with all the other features that you enable in the block.

Select this parameter to extract the 99% occupied bandwidth of the input signal.

Occupied bandwidth is the difference in frequency between the points where the integrated power crosses the ½(100 – p) and ½(100 + p) percentages of the total power in the spectrum. p is the power percentage value you specify in the Percentage extractor parameter. If not specified, p equals 99. For more information about the occupied bandwidth feature, see obw.

If you select this parameter, the feature-extractor block enables this feature for extraction, extracts this feature, and concatenates it with all the other features that you enable in the block. In addition, the block also enables the Specify parameters for occupied bandwidth parameter.

If you select the Specify parameters for occupied bandwidth parameter, the Percentage extractor parameter for occupied bandwidth appears in the Extractor parameters tab of the block dialog box.

Select this parameter to extract the 3-dB (half-power) bandwidth of the input signal. Power bandwidth is the 3-dB (half-power) bandwidth of the input signal. For more information about the power bandwidth feature, see powerbw.

If you select this parameter, the feature-extractor block enables this feature for extraction, extracts this feature, and concatenates it with all the other features that you enable in the block. In addition, the block also enables the Specify parameters for power bandwidth parameter.

If you select the Specify parameters for power bandwidth parameter, the Relative amplitude extractor parameter for power bandwidth appears in the Extractor parameters tab of the block dialog box.

Select this parameter to extract the power spectral density estimate of the input signal. For more information about this feature, see pwelch.

If you select this parameter, the feature-extractor block enables this feature for extraction, extracts this feature, and concatenates it with all the other features that you enable in the block. In addition, the block also enables the Specify parameters for Welch PSD parameter.

If you select the Specify parameters for Welch PSD parameter, several extractor parameters for Welch PSD appear in the Extractor parameters tab of the block dialog box.

Select this parameter to extract the peak spectral amplitude of the input signal. For more information about the peak spectral amplitude feature, see pwelch.

If you select this parameter, the feature-extractor block enables this feature for extraction, extracts this feature, and concatenates it with all the other features that you enable in the block. In addition, the block also enables the Specify parameters for peak amplitude parameter.

If you select the Specify parameters for peak amplitude parameter, several parameters for extracting peak amplitude appear in the Extractor parameters tab of the block dialog box.

Select this parameter to extract the peak spectral locations of the input signal. For more information about the peak spectral location feature, see pwelch.

If you select this parameter, the feature-extractor block enables this feature for extraction, extracts this feature, and concatenates it with all the other features that you enable in the block. In addition, the block also enables the Specify parameters for peak location parameter.

If you select the Specify parameters for peak location parameter, several parameters for extracting peak locations appear in the Extractor parameters tab of the block dialog box.

Feature to output mapping

Expand this section to display the column index of each feature in the output. Each feature extracted from the input signal appears in one or more columns of the output. For each feature listed in the Feature section of the table, the corresponding entry in the Column index in output section displays the column index where the feature appears in the output signal.

Extractor parameters

Note

When you select Specify parameters for feature in the Block parameters tab, the block enables the following parameters in the Extractor parameters tab. You can use the default values of these parameters or customize them further.

Extractor parameters for occupied bandwidth

Specify the power percentage p for the occupied bandwidth as a positive scalar in the range (0,100). The block computes the occupied bandwidth as the difference in frequency between the points where the integrated power crosses the ½(100 – p) and ½(100 + p) percentages of the total power in the spectrum.

Dependencies

To enable this parameter, select Specify parameters for occupied bandwidth.

Extractor parameters for power bandwidth

Specify the power level drop as a positive scalar.

Dependencies

To enable this parameter, select Specify parameters for power bandwidth.

Extractor parameters for Welch PSD

Specify the number of overlapping samples D between consecutive segments each of length M while computing the Welch PSD. You can specify one of these options:

  • default — The block uses an overlap of 50%.

  • Positive integer

The block splits each frame of data into P overlapping segments, each of length M, overlapping by D samples. The overlap length must be less than the length of the window that you specify in the Window parameter.

For more information, see Algorithms.

Dependencies

To enable this parameter, select Specify parameters for Welch PSD.

Specify the spectral estimation window w(n) as one of these:

  • default — The block uses a hamming window. For more information, see hamming.

  • Numeric vector — Specify a custom window. The length of this window must be less than the window length you specify in the Window length parameter.

The block applies this window to each of the P overlapping data segments in the time domain. For more information, see Algorithms.

Dependencies

To enable this parameter, select Specify parameters for Welch PSD.

Specify the frequencies using one of these options:

  • Specify FFT length — Specify the FFT length using the FFT length parameter.

  • Specify frequency vector — Specify the frequency vector directly using the Frequency vector parameter.

Dependencies

To enable this parameter, select Specify parameters for Welch PSD.

Specify the number of DFT points as:

  • default — The default FFT length is given by max(256,2nextpow2(length(window))).

  • Positive integer

Dependencies

To enable this parameter, select Specify parameters for Welch PSD and set Frequency mode to Specify FFT length.

Specify the frequencies for DFT computation as one of these:

  • default — The number of FFT points is given by max(256,2nextpow2(length(window))).

    If you specify Spectrum type to one-sided, the frequencies are uniformly spaced between 0 and Fs/2, where Fs is the sample rate you obtain from the Sample rate parameter. If you specify Spectrum type to two-sided, the frequencies are uniformly spaced between 0 and Fs.

  • Numeric vector

Dependencies

To enable this parameter, select Specify parameters for Welch PSD and set Frequency mode to Specify frequency vector.

Specify the type of power spectrum as one of these:

  • one-sided — The spectral frequencies range from 0 to Fs/2, where Fs is the sample rate you obtain from the Sample rate parameter.

  • two-sided — The spectral frequencies range from 0 to Fs.

Dependencies

To enable this parameter, one of these must apply:

  • Select Specify parameters for Welch PSD and set Frequency mode to Specify FFT length.

  • Select Specify parameters for Welch PSD. Set Frequency mode to Specify frequency vector and Frequency vector to default.

Extractor parameters for peak amplitude and peak location

Specify the maximum number of extrema (maxima or minima) to be extracted as a positive integer.

Dependencies

To enable this parameter, select Specify parameters for peak amplitude or Specify parameters for peak location.

Specify the minimum separation between extrema (maxima or minima) as a nonnegative scalar.

Dependencies

To enable this parameter, select Specify parameters for peak amplitude or Specify parameters for peak location.

Specify the minimum prominence for a point to be considered as an extrema. This value must be a nonnegative scalar.

The block returns only local extrema whose prominence is at least the value you specify in this parameter. Higher prominence values return fewer detected extrema. The prominence of a local maximum (or peak) is a measure of how the peak stands out with respect to its height and location relative to other peaks. The prominence of a local minimum is a measure of how the local minimum stands out with respect to its depth and location relative to other minima.

Dependencies

To enable this parameter, select Specify parameters for peak amplitude or Specify parameters for peak location.

Specify the element to consider as a local extrema when you have a flat region that contains consecutive extrema values.

  • center — Indicates only the center element of a flat region as the local extrema

  • first — Indicates only the first element of a flat region as the local extrema

  • last — Indicates only the last element of a flat region as the local extrema

  • all — Indicates all the elements of a flat region as the local extrema

Dependencies

To enable this parameter, select Specify parameters for peak amplitude or Specify parameters for peak location.

Specify the type of extrema as one of these:

  • maxima — Local maxima

  • minima — Local minima

Dependencies

To enable this parameter, select Specify parameters for peak amplitude or Specify parameters for peak location.

Block Characteristics

Data Types

double | single

Direct Feedthrough

no

Multidimensional Signals

no

Variable-Size Signals

no

Zero-Crossing Detection

no

More About

expand all

Algorithms

The Frequency Feature Extractor block extracts the frequency-domain features from the power spectral density (PSD) estimate of the input signal. The block uses the Welch's method of averaged modified periodograms to estimate the power spectral density.

Here are the steps in details.

  1. The Frequency Feature Extractor block buffers the input signal into frames of size WL, where WL is the window length you specify in the Window length parameter. Use the Overlap length parameter to specify the overlap length between frames. Alternately, use the Hop size parameter to specify the number of samples between the start of frames.

  2. Determine the power spectral density (PSD) of each frame using the Welch's method of averaged modified periodograms.

    • The block splits each data frame further into P overlapping data segments each of length M < WL, overlapping by D samples. You can specify this overlap length using the Overlap length parameter under Extractor parameters for Welch PSD. You can represent the data segments as:

      xi(n)=x(n+iD),n=0,1,...,M1i=0,1,...,P1

      • If D = M/2, the overlap is 50%. By default, the block overlaps the data segments by 50%.

      • If D = 0, the overlap is 0%.

    • Apply a window to each of the P overlapping data segments in the time domain. For each windowed segment, the block computes the periodogram, squares the magnitude of the result, and divides the result by M.

      Pxxi(f)=1MU|n=0M1xi(n)w(n)ej2πfn|2,i=0,1,...,P1

      where U is the normalization factor for the power in the window function and is given by

      U=1Mn=0M1w2(n)

      You can specify the window function w(n) using the Window parameter under Extractor parameters for Welch PSD.

    • The block calculates the power spectral density for each data segment using the modified periodogram estimator. For more information about the Periodogram method, see periodogram. To determine the power spectrum density for the entire frame, the block averages the result of the periodograms for all the P data segments using the sliding window method and divides the result by the input sample rate Fs. The averaging reduces the variance, compared to the original frame.

      PSD(f)=1P*Fsi=0P1Pxxi(f)

  3. When you select a specific frequency-domain feature to extract, the block extracts the feature from the power spectral density data, outputs it in the column specified by the Feature to output mapping parameter.

Extended Capabilities

expand all

C/C++ Code Generation
Generate C and C++ code using Simulink® Coder™.

Version History

Introduced in R2026a