Rank Broker Performance
This example shows how to determine the best performing brokers across transactions using transaction cost analysis from the Kissell Research Group. You rank brokers based on broker value add and arrival cost, and then determine which brokers perform best in which market conditions and trading characteristics. A positive value add indicates that the broker exceeds performance expectations given actual market conditions and trade characteristics, which results in fund savings. A negative value add indicates that the broker did not meet performance expectations, which result in an incremental cost to the fund.
In this example, you find which brokers over- or under-perform by comparing arrival costs and estimated trading costs. A broker with an arrival cost that is less than the estimated trading cost over-performs, which causes the fund to save money. A broker with an arrival cost that is greater than the estimated trading cost under-performs, which causes the fund to incur an incremental cost.
This example also shows how to estimate costs by broker, which requires custom market-impact parameters for each broker.
You can use similar steps as in this example to rank trading venues and algorithms.
To access the example code, enter edit
KRGTradePerformanceRankingExample.m at the command line.
After executing the code in this example, you can submit an order for execution using Bloomberg®, for example.
Retrieve Market-Impact Parameters and Load Data
Retrieve the market-impact data from the Kissell Research Group FTP site.
Connect to the FTP site using the ftp function with a user
name and password. Navigate to the MI_Parameters folder and
retrieve the market-impact data with broker codes in the
MI_Broker.csv file. miData contains
the encrypted market-impact date, code, and parameters.
f = ftp('ftp.kissellresearch.com','username','pwd');
mget(f,'MI_Broker.csv');
close(f)

miData = readtable('MI_Broker.csv','delimiter',',', ...
    'ReadRowNames',false,'ReadVariableNames',true);
Create a Kissell Research Group transaction cost analysis object
k. Specify initial settings for the date, market-impact
code, and number of trading days.
k = krg(miData,datetime('today'),1,250);Load the example data TradeData, Basket,
and BrokerNames, which is included with the Datafeed Toolbox™.
load KRGExampleData.mat TradeData Basket BrokerNames
For a description of the example data, see Interpret Variables in Kissell Research Group Data Sets.
Calculate Costs for Each Broker
Select the trade categories. Calculate the average arrival cost, market-impact cost, and broker value add for each broker.
TradeData.TradeSize = TradeData.Shares ./ TradeData.ADV;
TradeData.ArrivalCost = TradeData.SideIndicator .* ...
    (TradeData.AvgExecPrice ./ TradeData.ArrivalPrice-1) * 10000;
TradeData.MI = marketImpact(k,TradeData);
TradeData.ValueAdd = TradeData.MI - TradeData.ArrivalCost;
Retrieve broker names and the number of brokers. Preallocate output data variables.
uniqueBrokers = unique(TradeData.Broker);
numBrokers = length(uniqueBrokers);
avgCost = NaN(numBrokers,1);
avgMI = NaN(numBrokers,1);
avgValueAdd = NaN(numBrokers,1);
Rank Brokers by Average Broker Value Add
Calculate broker ranking using a transaction size between 5% and 10% of average daily volume (ADV). Calculate average arrival cost, average market-impact cost, and average broker value add.
indBroker = (TradeData.TradeSize >= 0.05) & (TradeData.TradeSize <= 0.10);

if any(indBroker)
    TD = TradeData(indBroker,:);
    for i = 1:numBrokers
        j = strcmp(TD.Broker,uniqueBrokers(i));
        if any(j)
            avgCost(i) = mean(TD.ArrivalCost(j));
            avgMI(i) = mean(TD.MI(j));
            avgValueAdd(i) = mean(TD.ValueAdd(j));
        end
    end
end

% Get valid average cost values (non NaN's)
indAvgCost = ~isnan(avgCost);
Create a table to store the broker ranking. Sort the ranking by average cost.
BrokerRankings = table(uniqueBrokers(indAvgCost),(1:sum(indAvgCost))', ...
    avgCost(indAvgCost),avgMI(indAvgCost),avgValueAdd(indAvgCost), ...
    'VariableNames',{'Broker','Rank','AvgArrivalCost','AvgMI','AvgValueAdd'});
BrokerRankings = sortrows(BrokerRankings,-5);
BrokerRankings.Rank = (1:sum(indAvgCost))';  % Reset rank
Compare the average broker value add in basis points using a bar graph.
bar(BrokerRankings.AvgValueAdd)
set(gca,'XTickLabel',BrokerRankings.Broker)
ylabel('Average Value Add (bp)')
title('Average Value Add by Broker')
grid
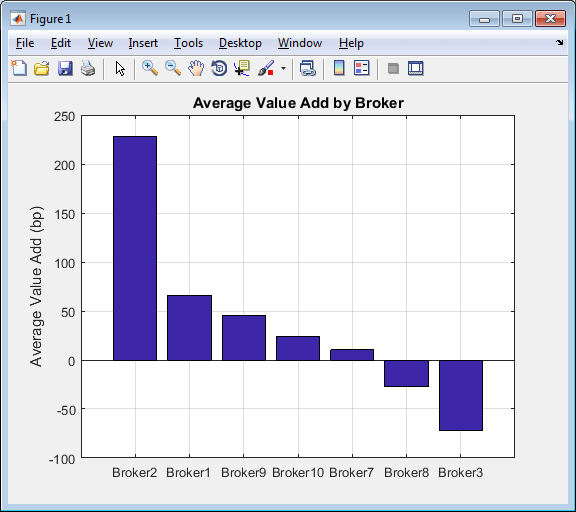
The broker Broker2 over-performs while
Broker3 under-performs across transactions. Decide to use
Broker2 for future transactions.
Estimate Trading Costs for Trade List
Estimate the trading costs for each broker using a specified order or trade list.
% Get the number of orders from the trade list table
numOrders = size(Basket.Symbols,1);

% Calculate pre-trade cost for each broker for each order
BrokerPreTrade = zeros(numOrders,numBrokers);
for i = 1:numBrokers
    % Market-impact code for broker corresponds to the MICode in the market
    % impact data, for example, Broker1 = 1.
    k.MiCode = i;

    % Calculate market-impact cost for each broker
    BrokerPreTrade(:,i) = marketImpact(k,Basket);
end

% Convert output to a table with the symbols used as the row names.
BrokerPreTrade = array2table(BrokerPreTrade,'VariableNames', ...
    BrokerNames.Broker,'RowNames',Basket.Symbols);
Compare Market-Impact Costs by Broker
For one stock ABC, compare market-impact cost in basis
points for each broker using a bar graph.
% Plot best broker for given stock
bar(table2array(BrokerPreTrade(1,:)))
set(gca,'XTickLabel',BrokerNames.Broker)
ylabel('Market-Impact Cost (bp)')
title(['Market-Impact Cost by Broker for Symbol ' ...
    BrokerPreTrade.Properties.RowNames{1}])
grid

The broker Broker8 has the highest market-impact cost and
Broker1 has the lowest one. Decide to use
Broker1 for executing the transaction using stock
ABC.
For details about the preceding calculations, contact the Kissell Research Group.
References
[1] Kissell, Robert. The Science of Algorithmic Trading and Portfolio Management. Cambridge, MA: Elsevier/Academic Press, 2013.
[2] Malamut, Roberto. “Multi-Period Optimization Techniques for Trade Scheduling.” Presentation at the QWAFAFEW New York Conference, April 2002.
[3] Kissell, Robert, and Morton Glantz. Optimal Trading Strategies. New York, NY: AMACOM, Inc., 2003.