Conduct Stress Test on Portfolio
This example shows how to conduct a stress test on a set of stocks using transaction cost analysis from the Kissell Research Group.
Estimate historical market-impact costs and the corresponding dollar values for the specified date range.
Use trading costs to screen stocks in a portfolio and estimate the cost to liquidate or purchase a specified number of shares.
Analyze trading costs during volatile periods of time such as a financial crisis, flash crash, or debt crisis.
To access the example code, enter edit
KRGStressTestingExample.m at the command line.
Retrieve Market-Impact Parameters and Load Historical Data
Retrieve the market-impact data from the Kissell Research Group FTP site.
Connect to the FTP site using the ftp function with a user
name and password. Navigate to the MI_Parameters folder and
retrieve the market-impact data in the
MI_Encrypted_Parameters.csv file.
miData contains the encrypted market-impact date, code,
and parameters.
f = ftp('ftp.kissellresearch.com','username','pwd');
mget(f,'MI_Encrypted_Parameters.csv');
close(f)

miData = readtable('MI_Encrypted_Parameters.csv','delimiter', ...
    ',','ReadRowNames',false,'ReadVariableNames',true);
Load the example data TradeDataStressTest from the file
KRGExampleData.mat, which is included with the
Datafeed Toolbox™.
load KRGExampleData TradeDataStressTest
For a description of the example data, see Interpret Variables in Kissell Research Group Data Sets.
Create a Kissell Research Group transaction cost analysis object
k. Specify initial settings for the date, market-impact
code, and number of trading days.
k = krg(miData,datetime('today'),1,250);Prepare Data for Stress Testing
Specify the date range from May 1, 2015, through July 31, 2015.
startDate = '5/1/2015';
endDate = '7/31/2015';
Determine the number of stocks numStocks in the portfolio.
Create a date range dateRange from the specified dates. Find
the number of days numDates in the date range.
numStocks = length(TradeDataStressTest.Symbol);
dateRange = (datenum(startDate):datenum(endDate))';
numDates = length(dateRange);
Preallocate the output data table o.
outLength = numStocks*numDates;
symbols = TradeDataStressTest.Symbol(:,ones(1,numDates));
sides = TradeDataStressTest.Side(:,ones(1,numDates));
dates = dateRange(:,ones(1,numStocks))';

o = table(symbols(:),sides(:),dates(:),NaN(outLength,1),NaN(outLength,1), ...
    'VariableNames',{'Symbol','Side','Date','MI','MIDollar'});
Ensure that the number of shares is a positive value using the
abs function.
TradeDataStressTest.Shares = abs(TradeDataStressTest.Shares);
Convert trade time trade strategy to the percentage of volume trade strategy.
TradeDataStressTest.TradeTime = TradeDataStressTest.TradeTime ...
    .* TradeDataStressTest.ADV;
TradeDataStressTest.POV = krg.tradetime2pov(TradeDataStressTest.TradeTime, ...
    TradeDataStressTest.Shares);
Conduct Stress Test by Estimating Historical Market-Impact Costs
Estimate the historical market-impact costs for each stock in the portfolio
for the date range using marketImpact. Convert
market-impact cost from decimal into local dollars. Retrieve the resulting data
in the output data table o.
kk = 1;
for ii = dateRange(1):dateRange(end)

    for jj = 1:numStocks

        k.MiCode = TradeDataStressTest.MICode(jj);
        k.MiDate = ii;

        o.MI(kk) = marketImpact(k,TradeDataStressTest(jj,:));
        o.MIDollar(kk) = (TradeDataStressTest.Shares(jj) ...
            * TradeDataStressTest.Price(jj)) ...
            * o.MI(kk) /10000 * TradeDataStressTest.FXRate(jj);

        kk = kk + 1;

    end

end
Display the first three rows of output data.
o(1:3,:)
ans =

    Symbol    Side      Date        MI      MIDollar
    ______    ____    _________    _____    ________

    'A'       1.00    736085.00     3.84      384.31
    'B'       1.00    736085.00    11.43    14292.24
    'C'       1.00    736085.00    32.69    20430.65
The output data contains these variables:
Stock symbol
Side
Historical trade date
Historical market-impact cost in basis points
Historical market-impact value in local dollars
Retrieve the daily market-impact cost dailyCost. Determine
the number of days numDays in the output data. Loop through
the data and sum the market-impact costs for individual stocks for each
day.
numDays = length(o.Date)/numStocks;

idx = 1;
for i = 1:numDays

  dailyCost.Date(i) = o.Date(idx);
  dailyCost.DailyMiCost(i) = sum(o.MI(idx:idx+(numStocks-1)));
  idx = idx+numStocks;

end
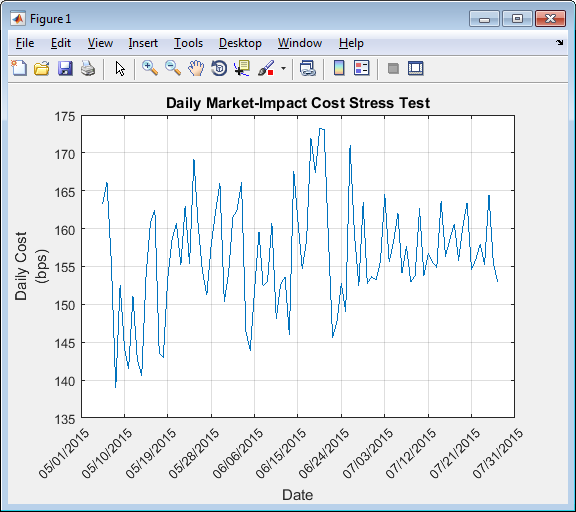
Display the daily market-impact cost in the specified date range. This figure demonstrates how market-impact costs change over time.
plot(b.Date,b.DailyMiCost)
ylabel({'Daily Cost','(bps)'})
title('Daily Market-Impact Cost Stress Test')
xlabel('Date')
grid on
xData = linspace(b.Date(1),b.Date(92),11);
a = gca;
a.XAxis.TickLabels = datestr(xData,'mm/dd/yyyy');
a.XTickLabelRotation = 45;
References
[1] Kissell, Robert. “Creating Dynamic Pre-Trade Models: Beyond the Black Box.” Journal of Trading. Vol. 6, Number 4, Fall 2011, pp. 8–15.
[2] Kissell, Robert. “TCA in the Investment Process: An Overview.” Journal of Index Investing. Vol. 2, Number 1, Summer 2011, pp. 60–64.
[3] Kissell, Robert. The Science of Algorithmic Trading and Portfolio Management. Cambridge, MA: Elsevier/Academic Press, 2013.
[4] Chung, Grace and Robert Kissell. “An Application of Transaction Costs in the Portfolio Optimization Process.” Journal of Trading. Vol. 11, Number 2, Spring 2016, pp. 11–20.