interp
Interpolate RF propagation data
Description
interpvalue = interp(pd,lat,lon)
interpvalue = interp(pd,Name=Value)
Examples
Define names and locations of sites around Boston.
names = ["Fenway Park","Faneuil Hall","Bunker Hill Monument"];
lats = [42.3467,42.3598,42.3763];
lons = [-71.0972,-71.0545,-71.0611];
Create array of transmitter sites.
txs = txsite("Name", names,...
       "Latitude",lats,...
       "Longitude",lons, ...
       "TransmitterFrequency",2.5e9);
Compute received power data for each transmitter site.
maxr = 20000;
pd1 = coverage(txs(1),"MaxRange",maxr);
pd2 = coverage(txs(2),"MaxRange",maxr);
pd3 = coverage(txs(3),"MaxRange",maxr);
Compute rectangle containing locations of all data.
locs = [location(pd1); location(pd2); location(pd3)];
[minlatlon, maxlatlon] = bounds(locs);
Create grid of locations over rectangle.
gridlength = 300;
latv = linspace(minlatlon(1),maxlatlon(1),gridlength);
lonv = linspace(minlatlon(2),maxlatlon(2),gridlength);
[lons,lats] = meshgrid(lonv,latv);
lats = lats(:);
lons = lons(:);
Get data for each transmitter at grid locations using interpolation.
v1 = interp(pd1,lats,lons);
v2 = interp(pd2,lats,lons);
v3 = interp(pd3,lats,lons);
Create propagation data containing minimum received power values.
minReceivedPower = min([v1 v2 v3],[],2,"includenan");
pd = propagationData(lats,lons,"MinReceivedPower",minReceivedPower);
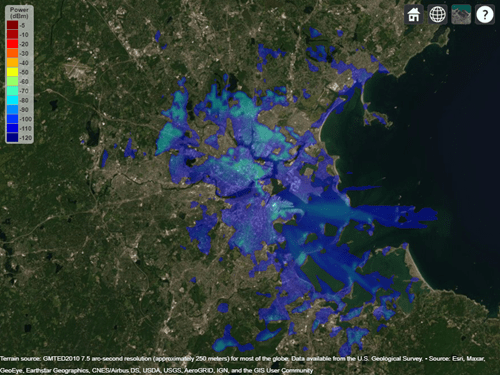
Plot minimum received power, which shows the weakest signal received from any transmitter site. The area shown may correspond to the service area of triangulation using the three transmitter sites.
sensitivity = -110;
contour(pd,"Levels",sensitivity:-5,"Type","power")

Input Arguments
Propagation data, specified as a propagationData object.
Latitude coordinate in degrees, specified as a vector with elements in the range [–90, 90]. The function assumes that the coordinates are referenced to the World Geodetic System of 1984 (WGS 84) reference ellipsoid.
Longitude coordinates in degrees, specified as a vector. The function assumes that the coordinates are referenced to the WGS 84 reference ellipsoid.
Name-Value Arguments
Specify optional pairs of arguments as
Name1=Value1,...,NameN=ValueN, where Name is
the argument name and Value is the corresponding value.
Name-value arguments must appear after other arguments, but the order of the
pairs does not matter.
Example: interp(pd,lat,lon,Method="linear") calculates the
interpolated values using a linear interpolation method.
Before R2021a, use commas to separate each name and value, and enclose
Name in quotes.
Example: interp(pd,lat,lon,"Method","linear") calculates the
interpolated values using a linear interpolation method.
Data variable to interpolate, specified as a character vector or
string scalar. The data variable must correspond to a variable name of
the table used to create the propagationData
object.
The default value is the DataVariableName
property of the specified propagationData
object.
Data Types: char | string
Method used to interpolate the data, specified as one of these options:
"natural"— Natural neighbor (Sibson) interpolation."linear"— Linear interpolation."nearest"— Nearest neighbor interpolation.
Data Types: char | string
Output Arguments
Version History
Introduced in R2020a
MATLAB Command
You clicked a link that corresponds to this MATLAB command:
Run the command by entering it in the MATLAB Command Window. Web browsers do not support MATLAB commands.
Select a Web Site
Choose a web site to get translated content where available and see local events and offers. Based on your location, we recommend that you select: .
You can also select a web site from the following list
How to Get Best Site Performance
Select the China site (in Chinese or English) for best site performance. Other MathWorks country sites are not optimized for visits from your location.
Americas
- América Latina (Español)
- Canada (English)
- United States (English)
Europe
- Belgium (English)
- Denmark (English)
- Deutschland (Deutsch)
- España (Español)
- Finland (English)
- France (Français)
- Ireland (English)
- Italia (Italiano)
- Luxembourg (English)
- Netherlands (English)
- Norway (English)
- Österreich (Deutsch)
- Portugal (English)
- Sweden (English)
- Switzerland
- United Kingdom (English)