Profile MEX Functions by Using MATLAB Profiler
You can profile execution times for MEX functions generated by MATLAB®
Coder™ by using the MATLAB Profiler. The profile for the generated code shows the number of calls and the
time spent for each line of the corresponding MATLAB function. Use the Profiler to identify the lines of MATLAB code that produce generated code that take the most time. This information can
help you identify and correct
performance issues early in the development cycle. For
more information on the MATLAB Profiler, see profile
and Profile Your Code to Improve Performance.
The graphical interface to the Profiler is not supported in MATLAB Online™.
MEX Profile Generation
You can run the MATLAB Profiler with a generated MEX function interactively at the command line.
Alternatively, if you have a test file that calls your MATLAB function, you can use the codegen command or the
MATLAB
Coder app to generate a MEX function and profile it in one step.
If the Profiler is running, you must turn it off before you generate a new profile. To turn off the Profiler, use this command:
profile off;Run the MATLAB Profiler Interactively
If you do not write a test file that calls your MATLAB function, you must run the Profiler interactively. To generate a MEX function suitable for profiling, use one of these approaches:
At the command line, create a MEX code configuration object. Set the
EnableMexProfilingproperty totrue. Generate code by using thecodegencommand and specify the configuration object. For example:cfg = coder.config("mex"); cfg.EnableMexProfiling = true; codegen -config cfg MyFunction
At the command line, generate code by using the
codegencommand with the-profileoption. For example:codegen MyFunction -profile
If you use the MATLAB Coder app, in MATLAB Coder tab of the toolstrip, click Output Type > MEX to instruct the code generator to produce a MEX function. On the toolstrip, click Settings to open the Code Generation Settings dialog box. On the Debugging pane, select the Enable execution profiling check box. Then, on the toolstrip, click Generate Code and Build to generate the MEX function.
Once you generate a MEX function suitable for profiling, use these commands to run the MATLAB Profiler and view the Profile Summary Report:
profile on;
MyFunction_mex;
profile viewer;
profile off;
Make sure that you have not changed or moved the original MATLAB file MyFunction.m. Otherwise, the Profiler is unable to
generate a profile for MyFunction_mex.
Generate and Profile MEX Function in One Step
If you have a test file that calls your MATLAB function, you can generate a MEX function and profile it in one step at the command line or by using the MATLAB Coder app. Use one of these approaches:
At the command line, generate a MEX function by using the
codegencommand with the-testand-profileoptions. For example:codegen MyFunction -test MyFunctionTest -profile
In MATLAB Coder tab of the toolstrip, click Output Type > MEX to instruct the code generator to produce a MEX function. On the toolstrip, click Settings to open the Code Generation Settings dialog box. On the Debugging pane, select the Enable execution profiling check box. On the toolstrip, click Run Generated MEX > Run file and select
MyFunctionTest.m.
MATLAB opens the Profiler window after MEX generation.
Example
You use the Profiler to identify the functions or the lines of the MATLAB code that produce generated code that take the most time. Following is an
example of a MATLAB function that converts the representation of its input matrices
A and B from row-major to column-major layout in one
of its lines. Such a conversion has a long execution time for large matrices. Avoiding the
conversion by modifying that particular line makes the function more efficient.
Consider the MATLAB function:
function [y] = MyFunction(A,B) %#codegen

% Generated code uses row-major representation of matrices A and B
coder.rowMajor;
length = size(A,1);

% Summing absolute values of all elements of A and B by traversing over the
% matrices row by row
sum_abs = 0;
for row = 1:length
   for col = 1:length
       sum_abs = sum_abs + abs(A(row,col)) + abs(B(row,col));
   end
end

% Calling external C function 'foo.c' that returns the sum of all elements
% of A and B
sum = 0;
sum = coder.ceval('foo',coder.ref(A),coder.ref(B),length);

% Returning the difference of sum_abs and sum
y = sum_abs - sum;
end
The generated code for this function uses a row-major representation of the square
matrices A and B. The code first computes
sum_abs (the sum of absolute values of
all elements of A and
B) by traversing over the matrices row by row. This algorithm is
optimized for matrices that are represented in a row-major layout. The code then uses
coder.ceval to call the external C function foo.c:
#include <stdio.h>
#include <stdlib.h>
#include "foo.h"

double foo(double *A, double *B, double length)
{
 int i,j,s;
 double sum = 0;
 s = (int)length;

 /*Summing all the elements of A and B*/
 for(i=0;i<s*s;i++)
 {
         sum += A[i] + B[i];
 }
 return(sum);
}
The corresponding C header file foo.h is:
#include "rtwtypes.h"

double foo(double *A, double *B, double length);
foo.c returns the variable sum, which is the sum
of all elements of A and
B. The performance of the function
foo.c is independent of whether the matrices A and
B are represented in row-major or column-major layouts.
MyFunction returns the difference of sum_abs and
sum.
You can measure the performance of
MyFunction for large input matrices A and
B, and then optimize it further:
Enable MEX profiling and generate MEX code for
MyFunction. RunMyFunction_mexfor two large random matricesAandB. View the Profile Summary Report.A = rand(20000); B = rand(20000); codegen MyFunction -args {A,B} foo.c foo.h -profile profile on; MyFunction_mex(A,B); profile viewer;
A separate window opens showing the Profile Summary Report.

The Profile Summary Report shows the total time and the self time for the MEX file and its child, which is the generated code for the original MATLAB function.
Under Function Name, click the first link to view the Profile Detail Report for the generated code for
MyFunction. You can see the lines where the most time was spent: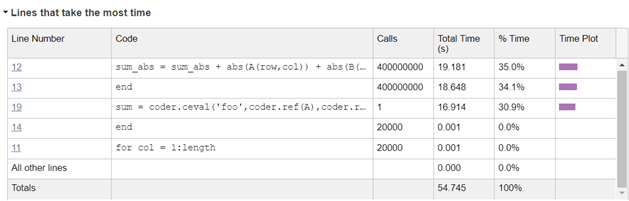
The line calling
coder.cevaltakes a lot of time (16.914 s). This line has considerable execution time becausecoder.cevalconverts the representation of the matricesAandBfrom row-major layout to column-major layout before passing them to the external C function. You can avoid this conversion by using an additional argument-layout:rowMajorincoder.ceval:sum = coder.ceval('-layout:rowMajor','foo',coder.ref(A),coder.ref(B),length);
Generate the MEX function and profile again using the modified
MyFunction.The Profile Detail Report forA = rand(20000); B = rand(20000); codegen MyFunction -args {A,B} foo.c foo.h -profile profile on; MyFunction_mex(A,B); profile viewer;
MyFunctionshows that the line callingcoder.cevalnow takes only 0.653 s: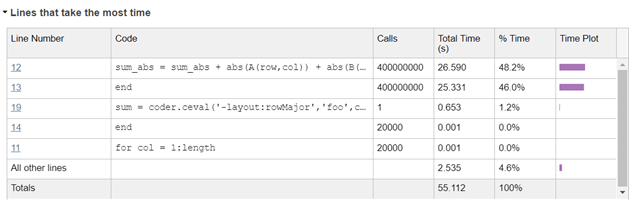
Effect of Folding Expressions on MEX Code Coverage
When you use coder.const to fold expressions into constants, it
causes a difference in the code coverage between the MATLAB function and the MEX function. For example, consider the function:
function y = MyFoldFunction %#codegen
a = 1;
b = 2;
c = a + b;
y = 5 + coder.const(c);
end
Profiling the MATLAB function MyFoldFunction shows this code coverage in the
Profile Detail Report:
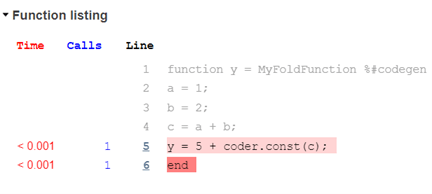
However, profiling the MEX function MyFoldFunction_mex shows a
different code coverage:

Lines 2, 3, and 4 are not executed in the generated code because you have folded the
expression c = a + b into a constant for code generation.
This example uses user-defined expression folding. The code generator sometimes automatically folds certain expressions to optimize the performance of the generated code. Such optimizations also cause the coverage of the MEX function to be different from the MATLAB function.
See Also
profile | codegen | coder.MexCodeConfig | coder.rowMajor | coder.ceval | coder.const