Execution-Time Profiling for NVIDIA Jetson Platforms in Simulink
You can create execution-time profiles for Simulink® generated code running on NVIDIA® Jetson™ platforms to measure execution times on the Jetson hardware. To create an execution-time profile, you specify configuration parameters for the profile, then generate the profile using processor-in-the-loop (PIL) or external mode simulations. You can analyze the profiling data from the PIL or external mode simulation using the Code Profile Analyzer.
Open a Simulink Model for Profiling
This example uses the Simulink model TopModelPil.slx from the example Verify Generated Code on NVIDIA Targets Using PIL in Simulink. The model accepts an
input signal from the MATLAB® workspace and counts the number of peaks.
To open the model, execute this command in the MATLAB Command Window:
openExample("nvidia/PILExecutionOnNVIDIATargetsUsingSimulinkExample",...
"supportingFile","TopModelPil.slx")
To create an input data signal with the correct
dimensions, use the model stop time and step size. The model uses a stop time of 10 seconds
and a step size of 0.2 seconds. Create a struct named Input with two fields:
time, which contains the time of each step in the modelsignals, which contains the value of the input at each step
StopTime = 10;
StepSize = 0.2;
Input.time = (0:StepSize:StopTime)';
Input.signals.values = sin(Input.time);
Input.signals.dimensions = 1;
To load inputs from the MATLAB workspace, enable the LoadExternalInput parameter. Specify
the ExternalInput parameter to load the Input variable
from the MATLAB
workspace.
set_param("TopModelPil","LoadExternalInput","on");
set_param("TopModelPil","ExternalInput","Input");
Connect to NVIDIA Jetson
To communicate with the NVIDIA
Jetson hardware, create a live hardware connection object using the
jetson function. When connecting to the target board for the first
time, you must input the host name or IP address, user name, and password of the target
board.
hwobj = jetson("jetson-deviceaddress","username","password");
On subsequent connections, the Jetson hardware connection object reuses the settings from the most recent connection to an NVIDIA board.
hwobj = jetson;
Configure the Simulink Model for Execution-Time Profiling
Before you create an execution-time profile, you first enable profiling and set the configuration for the profile in the Configuration Parameters dialog box.
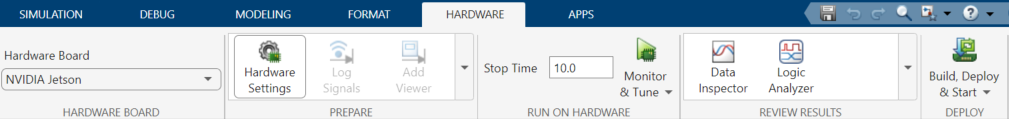
In the model, in the toolstrip, open the Apps tab. Under the Setup to Run on Hardware section, click Run on Hardware Board.
In the toolstrip, in the Hardware tab, click Hardware Settings. In the Configuration Parameters dialog box, in the left pane, open the Code Generation > Verification parameters.
In the Code execution time profiling section, select Measure task execution time.
To profile the reference model and subsystem functions in the generated code, set Measure function execution times to
Coarse
                (referenced models and subsystems only)
.
Alternatively, use the set_param function to configure
the model
programmatically.
set_param("TopModelPil","CodeExecutionProfiling","on");
set_param("TopModelPil","CodeProfilingInstrumentation","coarse");
Generate the Execution-Time Profile
To generate the execution-time profile, simulate the model using PIL or external mode simulation.
Generate Execution-Time Profile Using PIL
You can generate an execution-time profile by generating code for the model and running the code on NVIDIA Jetson using PIL. Simulink measures task execution times during the PIL simulation and creates an execution-time profile.
Set the SimulationMode parameter to processor-in-the-loop
(pil), and start PIL execution by using the sim
command.
set_param("TopModelPil","SimulationMode","processor-in-the-loop (pil)");
simOutput = sim("TopModelPil",StopTime);
simOutput contains the execution profile from the PIL simulation. By
default, the execution profile is named executionProfile. Access the
execution profile using dot
notation.simOutput.executionProfile
Generate Execution-Time Profile Using External Mode
Alternatively, you can generate an execution-time profile for the model using external mode simulation. First, configure the model to return the simulation output as one or more workspace variables.
set_param("TopModelPil","ReturnWorkspaceOutputs","off");
In the model, in the Hardware tab, click Monitor & Tune to run the model in external mode.
The simulation returns the executionProfile variable in the
MATLAB workspace.
View Profiling Data for the Model
To examine the profiling data from the model, use the Code Profile Analyzer.
Open the execution-time profile in the analyzer by using the
coder.profile.show function.
coder.profile.show(simOutput.executionProfile);
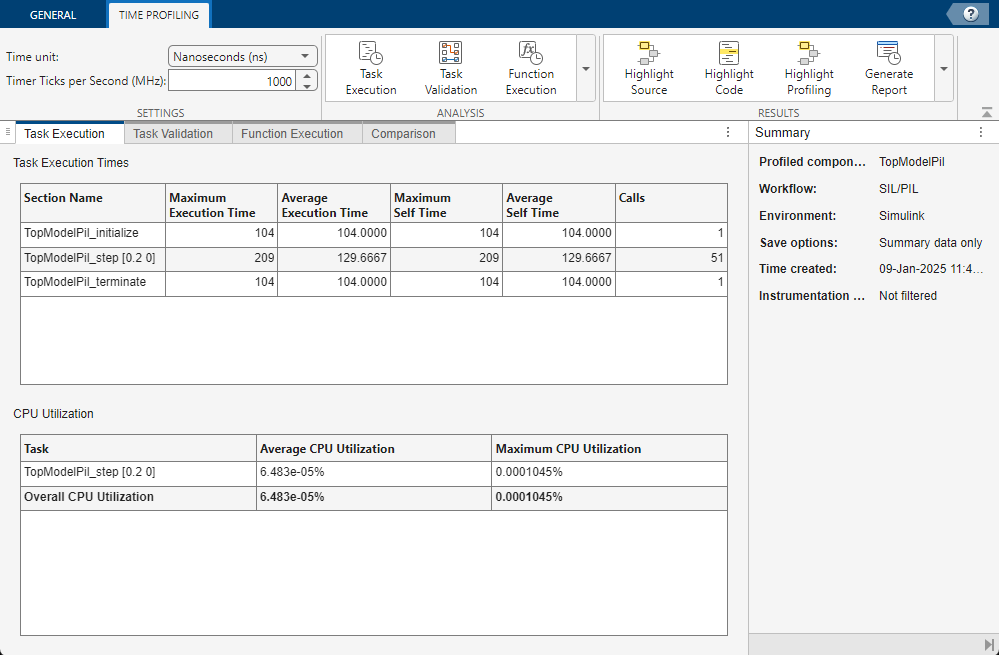
The analyzer contains the profiling data for the generated code, including:
The function execution times for:
The model initialize function,
TopModelPil_initializeThe model step function,
TopModelPil_stepThe model terminate function,
TopModelPil_terminate
The CPU utilization
The Code Profile Analyzer displays the time in ticks by default. To change the unit, in the toolstrip, use the Time unit parameter.
See Also
Objects
Apps
- Code Profile Analyzer (Embedded Coder)