Conventional Vehicle Powertrain Efficiency
The Powertrain Blockset™ vehicle reference applications include live scripts that you can run to evaluate and report energy and power losses at the component- and subsystem-level. This example shows how to examine the impact of the conventional vehicle transmission efficiency on the powertrain efficiency.
Running this example requires a Stateflow® license. You can install a Stateflow trial license using the Add-On Explorer.
Open the conventional vehicle reference application project. By default, the application has a mapped 1.5–L spark-ignition (SI) engine and a dual clutch transmission.
Project files open in a writable location.Double-click Analyze Power and Energy to open the live script. To generate the energy report, select Run.
The live script provides:
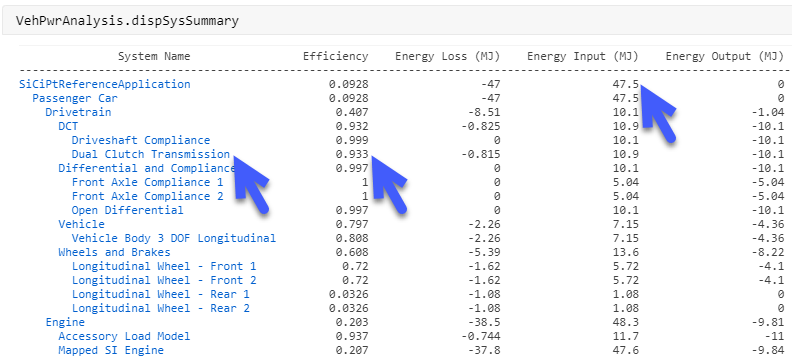
An overall energy summary and exported Excel® spreadsheet containing the data. For example, this is similar to the Overall Summary report for the conventional vehicle. The results indicate that the:
Overall powertrain input energy is
10.1kW*hIdeal fixed gear transmission average efficiency is
0.924

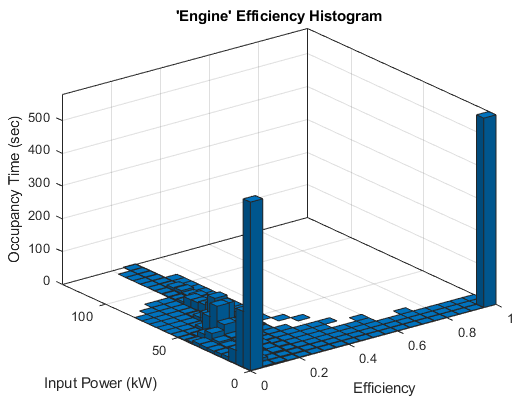
Engine and drivetrain efficiencies, including an engine histogram of time spent at the different engine efficiencies. For example, this is similar to the engine efficiency histogram for the conventional vehicle.

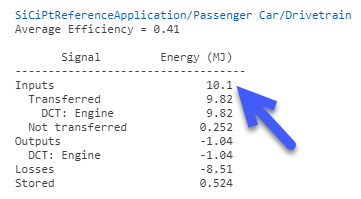
Drivetrain plant summary that provides the average efficiency, energy input, output, loss, and stored. For example, this is similar to the Drivetrain Plant Summary for the conventional vehicle. The results indicate that the drivetrain input energy is
2.71kW*h.
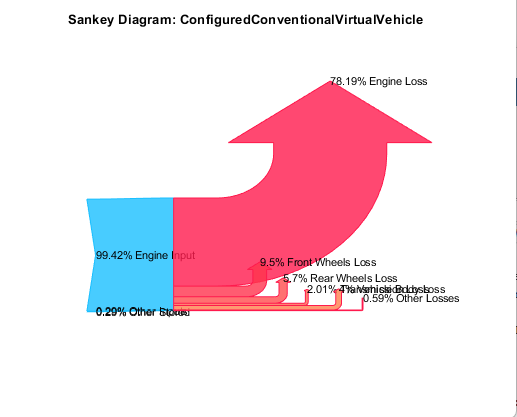
A Sankey diagram indicating engine losses. For example, this diagram is similar to the Sankey diagram for the conventional vehicle.

In the Overall Summary section of the report:
Select Ideal Fixed Gear Transmission to open the Ideal Fixed Gear Transmission block subsystem.
Select the Ideal Fixed Gear Transmission block.
Open the block mask.
Change the ideal fixed gear transmission so that it is less efficient.
Set the Efficiency factors parameter to
Gear only.Set the Efficiency vector, eta parameter to
.9*PlntTransEffVect.Save the model.

In the ConfiguredConventionalVirtualVehicle model window, click Analyze Power and Energy to open the live script. To generate the energy report, select Run.
After you run the live script, in the Overall Summary, examine the efficiencies. For example, these results indicate that the:
Overall powertrain input energy is
11.2kW*hIdeal fixed gear transmission average efficiency is
0.804
When the dual clutch transmission is less efficient, the powertrain requires more energy to complete the drive cycle.
